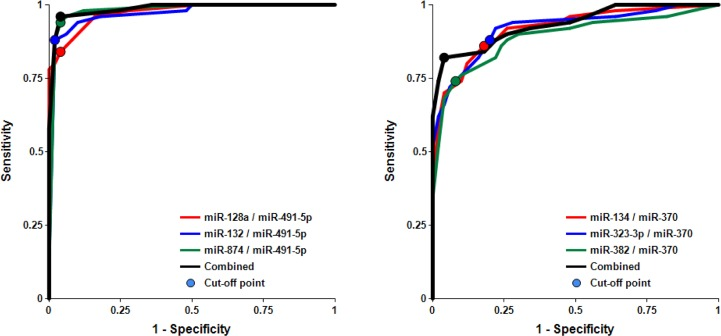
Figure 3.Receiver-Operating Characteristic (ROC) curve analysis of differentiation between MCI patients and age-matched controls obtained with different biomarker pairsThe areas under the ROC curve (AUC), sensitivity, specificity and accuracy for each biomarker/normalizer pair presented in Table 2 are calculated for the “cutoff” point (indicated as a dot on each plot) – the value of the ratio of paired miRNA where the accuracy of predictions is the highest (see Materials and Methods).