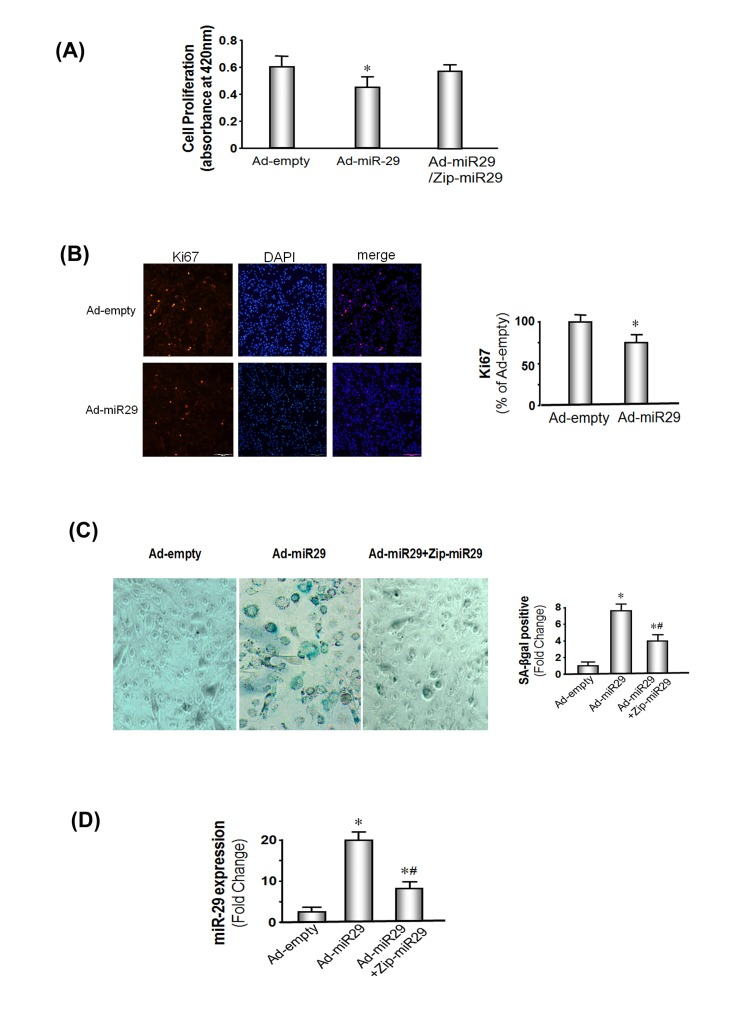
Figure 2.miR-29 expression decreases muscle cell proliferation and induces cellular senescence in MPCs(A) MPCs were transduced with Ad-miR-29 or the control adenovirus (Ad-empty). Proliferation was assessed using a chromogenic substrate and a commercial kit (Millipore) monitoring absorbance at 420 nm (Methods). The bars show the mean ± s.e. (n=6; *p<0.05 vs. Ad-empty). (B) MPCs were transduced with Ad-miR-29 or Ad-empty. The Ki67 expression, a marker of proliferation, was assessed by immunohistology. A positive Ki67 was determined as a bright red spot localized in the nuclei. The bar graph shows cells that were positively stained for Ki67 in miR-29 treated cells and are expressed as a percent of the positive cells in the Ad-empty treated cells. Counts were made in 5 pre-defined, randomly chosen fields; each field had >500 nuclei. Red staining in nuclei was assessed using the Micro-suite Five Biological Software (Bars: mean ± s.e.; n=6/condition; *p<0.05 vs. ad-empty). (C) MPCs were transduced with Ad-miR-29 or with the Ad-empty adenovirus. To block miR-29 expression in MPCs, vectors that express an antisense of Zip-miR29 (pmiRZip29a plus pmiRZip29c) were transfected into MPCs 4 hours before the Ad-miR-29 or Ad-empty viruses were added. The blue color identifies SA-βgal is present in cells with the “fried egg morphology” that signifies cellular senescence. The bar graph shows the percentage of cells with positive staining of SA-βgal in 5 pre-defined, randomly chosen fields (Bars: mean ± s.e.; n=6/condition; *p<0.05 vs. controls; #p<0.05 vs. Ad-miR-29). (D) MPCs were transduced with Ad-miR-29 or with Ad-empty adenovirus. To block miR-29 expression in MPCs, vectors that express an antisense of miR-29a+c (pmiRZip29a plus pmiRZip29c) were transfected into MPCs 4 hours before the Ad-miR29 or Ad-empty (Ctrl) viruses were added. miR-29a expression was measured using real-time qPCR; U6 was the internal control. The bar graph shows the amount of miR-29a expressed as a fold change from the level in controls (Bars: mean ± s.e.; ctrl defined as 1 fold; n=3 determinations per condition; *p<0.05 and #p<0.01 vs. Ad-miR29 only).