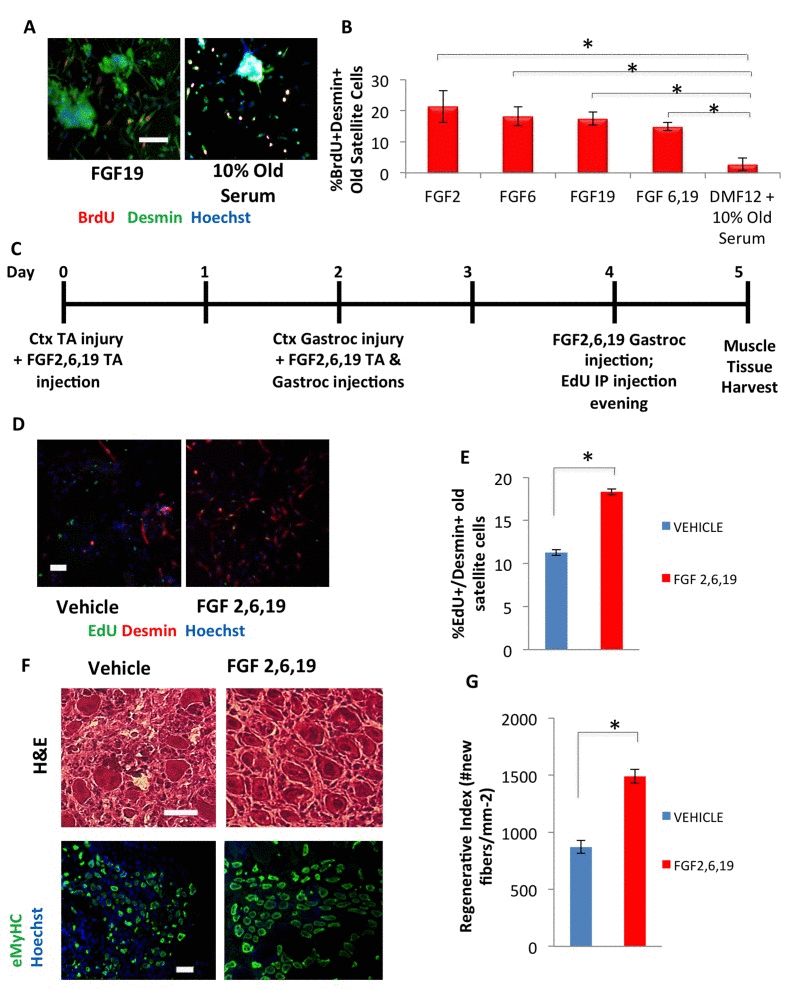
Figure 5.hESC candidate factors FGF2, 6, and 19 exhibit a pro-myogenic effect in an old environment and enhance old muscle regeneration in vivo(A) Old injury activated myofiber-associated satellite cells were isolated from 3 days post cardiotoxin-induced muscle injury, and cultured overnight in DMEM/F12 with 10% of old serum and 10 ng/mL FGF 2, 6, 19, or FGFs 6 and 19 in combination, followed by a 2 hour BrdU pulse to label proliferating cells before fixation. Immunofluorescence was performed with Desmin (green) and BrdU (red), with Hoechst (blue) labeling all cell nuclei. Representative images are shown. Scale bar = 100 μM (B) Proliferating myogenic Desmin+/BrdU+ satellite cells were counted. Results are displayed as the mean percent of BrdU+/Desmin+ proliferating satellite cell cells. Error bars indicate standard error of the mean (n=4). Significant differences were identified by Student's t tests (*p<0.0004). (C) Schematic of in vivo FGF2, 6, and 19 injection. EdU was injected (intraperitoneal) at Day 4 to label proliferating, fusion-competent myoblasts. (D) Old injury activated myofiber-associated satellite cells from at 3 days post cardiotoxin-induced muscle injury (Day 5 in schematic), and cultured overnight in Opti-MEM with 10% of their respective old serum, followed by cell fixation. Immunofluorescence was performed with Desmin (red) and EdU (green), with Hoechst (blue) labeling all cell nuclei. Representative images are shown and demonstrate that FGFs have a pro-myogenic and rejuvenating effect. Scale bar = 100 μM (E) Proliferating myogenic Desmin+/EdU+ satellite cells were quantified by cell scoring as in Figure 1. Results are displayed as the mean percent of EdU+/Desmin+ proliferating satellite cell cells +/−SD (n=4). Significant differences were identified by Student's t tests (*p<0.03). (F) Cryosections (10 μm) of old Tibialis Anterior muscles were analyzed by hematoxylin/eosin (H&E) staining and immunostaining for embryonic myosin heavy chain (eMyHC, shown in green). Hoechst stains nuclei (blue). Scale bars = 100 μM (G) Regeneration of old mice Tibialis Anterior muscle 5 days post injury, that received candidate factors FGF 2,6, and 19 or vehicle, were quantified from muscle sections and are presented as Regenerative Index, the number of newly regenerated myofibers per square millimeter of injury site. Error bars indicate standard error of the mean (n=4). Significant differences were identified by Student's t tests (*p<0.0007).