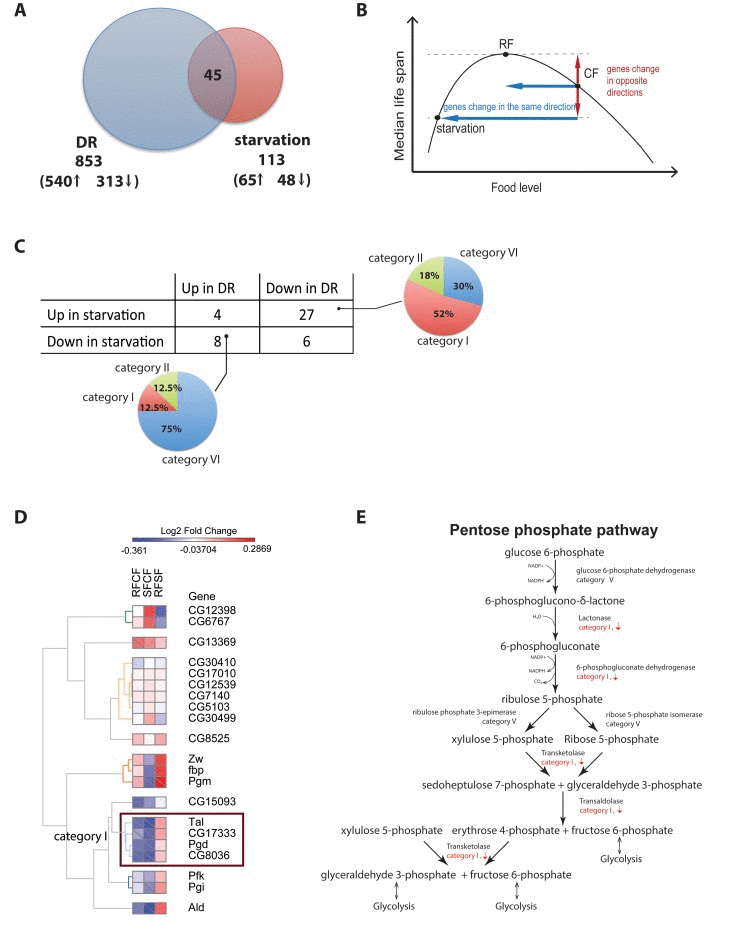
Figure 5.Different gene regulation between Dietary restriction and starvation(A) Comparison of dietary restriction and starvation in D. melanogaster. The intersection between both dietary interventions show a small number of genes (44) with most of them changing in opposite directions in starvation and dietary restriction. (B) Proposed model. As food level changes, genes that are change in the same direction for both starvation and Dietary Restriction are likely not involved in lifespan. However, genes that change in opposite directions in starvation vs. dietary restriction correlate with lifespan. (C) Contingency table of genes up- and down-regulated in chronic DR and starvation and their distributions in the different categories of responses to the diet switch. (D) Heatmap of the fold-changes between the three cohorts for all gene annotated in the KEGG pentose phosphate pathway. Cells marked with a diagonal bar correspond to genes and comparisons that reached statistical significance. (E) Transcriptional response to the diet switch of genes within the core steps in the pentose phosphate pathway