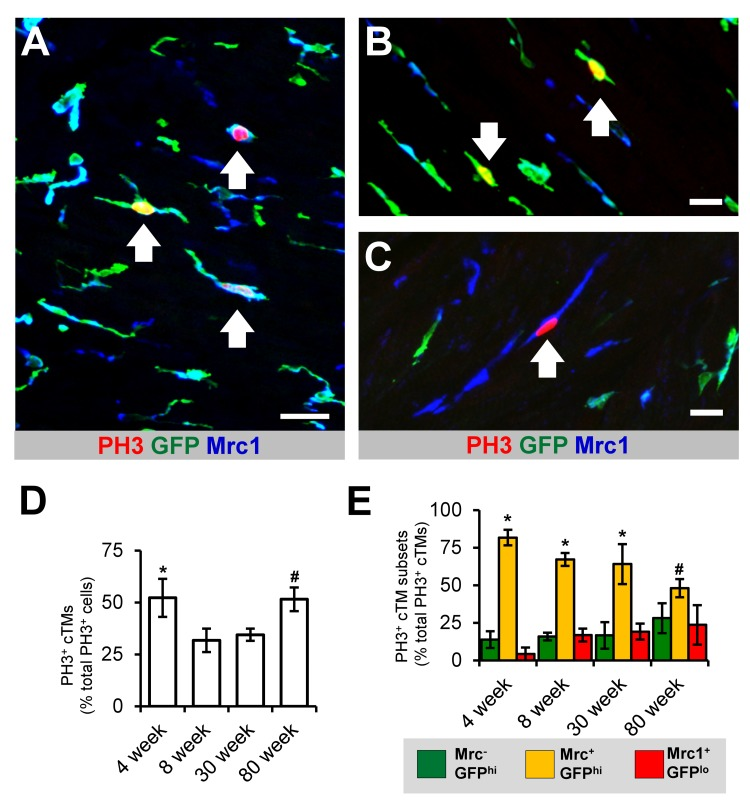
Figure 4.Proliferative potential of cTMs(A) 45 μm confocal micrograph maximum intensity view of GFPhi, Mrc1+ and PH3+ cells within the heart of an 8 week old Cx3cr1GFP/+ mouse heart. (B and C) Magnified view of PH3+ Mrc1−GFPhi and Mrc1+GFPlo cTMs, respectively. Scale bars indicates 30 μm (A) and 20 μm (B and C). Arrows indicate PH3+ cTMs. (D) Proportion of total cardiac PH3+ nuclei comprised of PH3+ cTM nuclei. *p>0.05 4 week old vs all other ages; #p>0.05 80 week old vs 8 or 30 week old. (E) Proportion of total PH3+ cTM nuclei comprised of Mrc1−GFPhi, Mrc1+GFPhi or Mrc1+GFPlo cTM nuclei. *p≤0.05 Mrc1+GFPhi vs Mrc1+GFPlo or Mrc1−GFPhi; *p>0.05 Mrc1+GFPhi vs Mrc1+GFPlo or Mrc1−GFPhi. All histograms show means ± SEM. PH3+ cell numbers were determined from 3 mouse hearts/age group from multiple fields of view