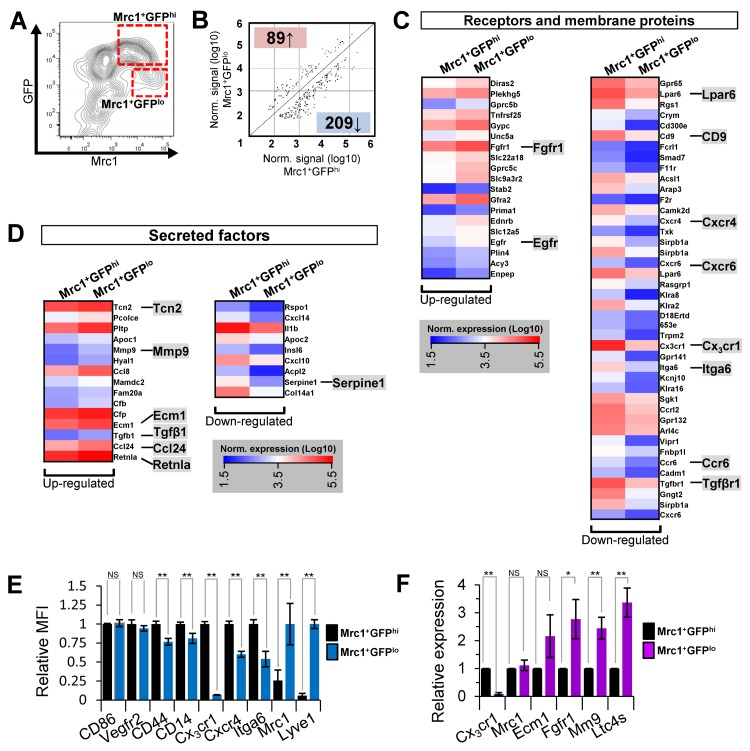
Figure 5.Microarray gene expression analysis of Mrc1+GFPhi and Mrc1+GFPlo cTM subsets and validation(A) Flow cytometry contour plot of cardiac myeloid (CD45+CD11b+) cells from Cx3cr1GFP/+ mouse hearts with cTMs isolated for microarray analysis indicated (red dotted boxes). (B) Scatter plot of Mrc1+GFPhi and Mrc1+GFPlo gene probes ≥2.0-fold enriched (p≤0.05). Number of genes up-regulated or down-regulated in Mrc1+GFPlo cTMs relative to Mrc1+GFPhi cTMs are highlighted red or blue. (C) Receptors and membrane proteins up- or down-regulated in Mrc1+GFPlo cTMs relative to Mrc1+GFPhi cTMs. (D) Secreted factors up- or down-regulated in Mrc1+GFPlo cTMs relative to Mrc1+GFPhi cTMs. (E) Flow-cytometry analysis of differentially expressed cell surface markers (n=5 per marker). MFI = mean fluorescence intensity. (F) qRT-PCR analysis of differentially expressed genes (n≥4 per gene). NS = non-significant; *p<0.05; **p<0.01