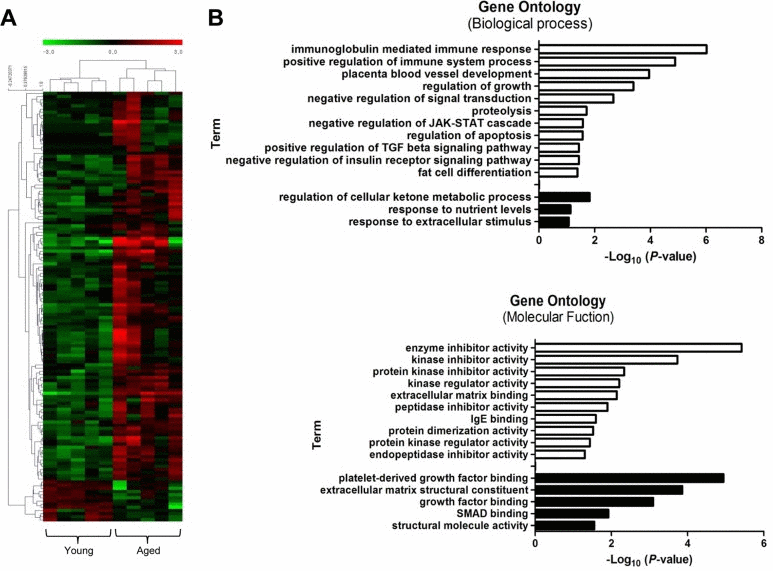
Figure 4.Transcriptional signature of aged skeletal muscle and its selected gene ontology terms of the mRNA transcriptome(A) Unsupervised hierarchical clustering of the 136 differentially regulated mRNAs with aging; 123 genes were up-regulated, and 13 genes were down-regulated. Each column presents the mRNA expression in young (n = 5) and aged (n = 5) muscle. The intensity represents the magnitude of the difference. Red and green denote high and low expression, respectively. (B) Bar plot for the -log10 of the P-value of the selected GO terms. The up- and down-regulated genes (2-fold change) were subjected to gene ontology analysis using DAVID. The enriched biological processes (upper) and molecular functions (lower) were plotted. White bar, enriched GO terms regulated by up-regulated genes; black bar, enriched GO terms regulated by down-regulated genes.