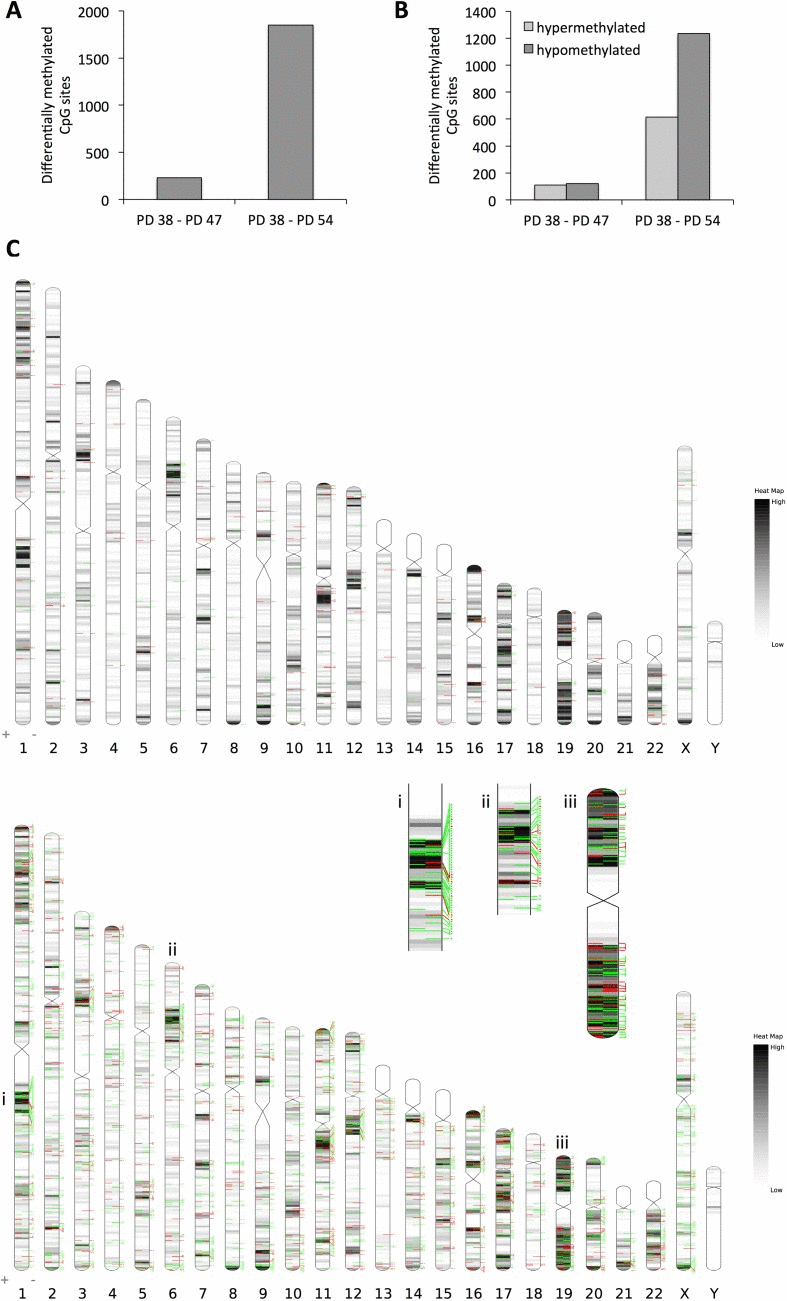
Figure 2.Changes in DNA methylation pattern in senescent cells(A) Number of CpG sites affected by differential methylation comparing PD 47 and PD 54 to PD 38 cultures. (B) Number of CpG sites in the given comparisons affected by hypo- (dark grey) or hypermethylation (light grey). (C) Distribution of CpG methylation changes across the chromosomes. Top: changes between PD 47 and PD 38; Bottom: changes between PD 54 and PD 38. Black/grey lines indicate gene densities, green lines represent CpG sites hypomethylated in the older cultures and red lines indicate CpG sites hypermethylated in older cultures.