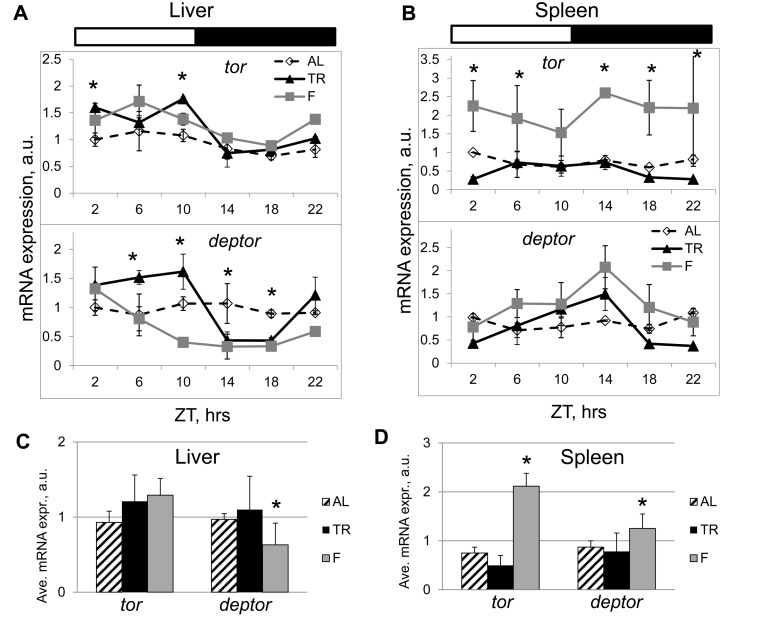
Figure 6.TR feeding results in rhythmic expression of mTORC1 components. Daily profiles of mRNA expression of tor and deptor in (A) the liver and (B) the spleen of mice subjected to AL (open diamonds, dashed black line), TR (black triangles, solid black line) and F (gray squares, gray line). The same animals have been analyzed on Figure 1, 2 and 3 for mTORC1 signaling. ZT0 is time when light turn on. (C and D) Average daily expression of tor and deptor in the liver (C) and in the spleen (D): AL (striped bars), TR (black bars), F (gray bars). 3 male mice per each time point and feeding regimen have been used. Data present Average +/− SEM; * − p<0.05, statistically significant difference between different treatments.