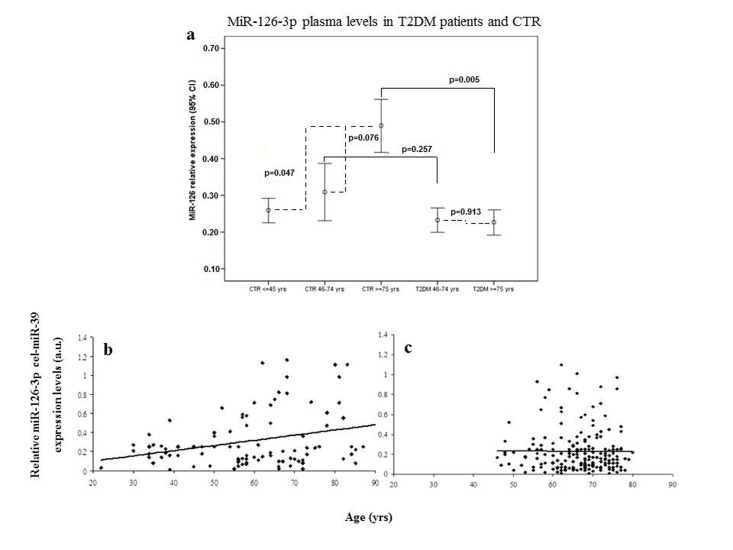
Figure 1.Relative miR-126-3p expression in plasma from 136 healthy subjects (CTR) and 193 patients (T2DM) divided into age groupsError bars (a) showing relative miR-126-3p expression (in a.u.) in plasma of young (20-45 years, n=44), elderly (46-74 years, n=57) and old (≥ 75 years, n=34) CTR and in plasma of T2DM subjects divided into two age groups (46-74 years, n=155 vs. ≥ 75 years, n=38). *p from t-test with Bonferroni correction for multiple comparisons. ANOVA, F= 4.887, p=0.001. Scatter plots (b and c) showing relative miR-126-3p expression (in arbitrary units, a.u.) according to age in CTR subjects (b) and T2DM patients (c). Data are expressed as mean of 2ΔΔΔCt normalized with cel-miR-39.