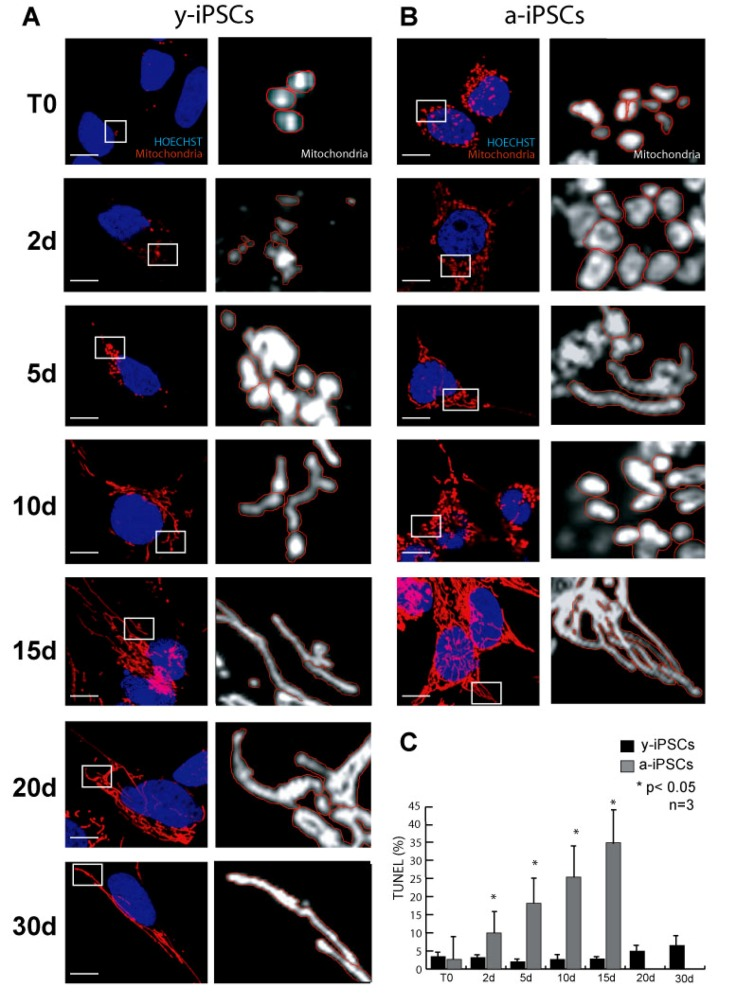
Figure 1.Characterization of mitochondria in y- and a-iPSCs in proliferating condition and during in vitro neurogenesis(A, B) Immunofluorescence analysis of mitochondria (red) in y-iPSCs (A) and in a-iPSCs (B) with nuclei counterstained with Hoechst (blue). On the right side of each photograph a higher magnification of the mitochondria is reported, mitochondria are colored in white and the perimeter is highlighted in red for better morphological visualization. Scale bar: 10 μm. (C) Quantification of the TUNEL assay in y- and a-iPSCs before and during neuronal differentiation. The bar graph represents quantitative data (expressed in % of TUNEL assay positive cells) of y-iPSCs and a-iPSCs. Data represent the mean ± SD of 3 experiments.