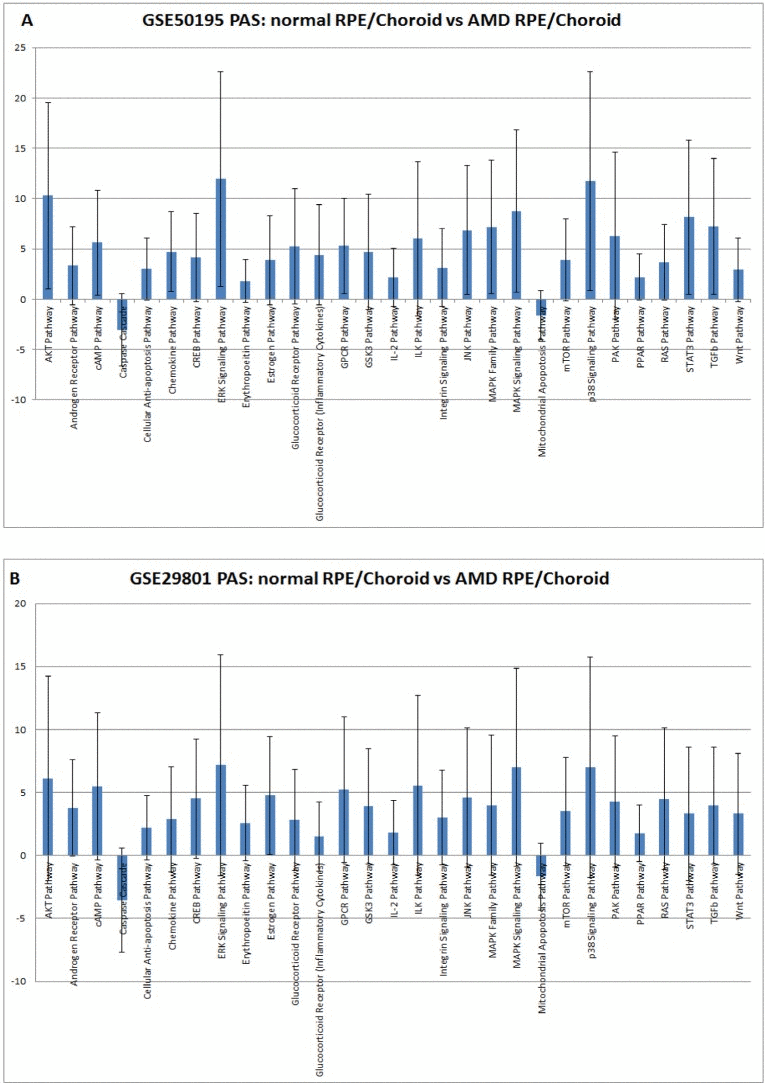
Figure 1.Pathway activation strength (PAS) for selected pathwaysPAS values have been calculated according to OncoFinder algorithm. PAS presented on this figure passed the following filters PAS<−1.5 and PAS>1.5 in both datasets. Blue bars represent PAS average for each pathway, and error bars represents standard deviation A. PAS derived from GSE50195 dataset. B. PAS derived from GSE50195 that cell-based inflammatory responses within the RPE-choroid are a core feature of AMD. However, cellular sources and targets of pro-inflammatory secreted factors are still need to be determined along with the regulatory mechanism of the chemokine network.