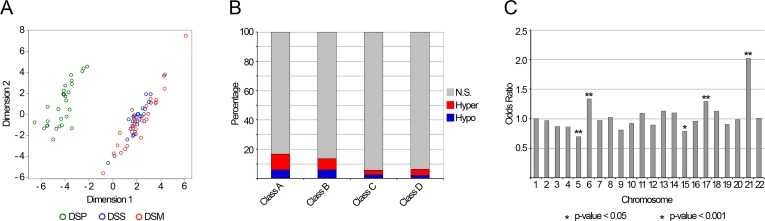
Figure 2.Down Syndrome associated DMRs(A) The MDS plot reports a bi-dimensional representation of the epigenetic distances between the samples under analysis, calculated using the methylation values of the 4648 BOPs selected as differentially methylated between DSP and DSS. (B) The percentage of identified DMRs is indicated for each of the four probes classes. DMRs are distinguished between hypermethylated and hypomethylated in DSP compared to DSS. (C) Chromosomal enrichment of the identified DMRs. For each chromosome, the Odds Ratio resulting from Fisher's exact test is reported. Significant enrichments are indicated with asterisks.