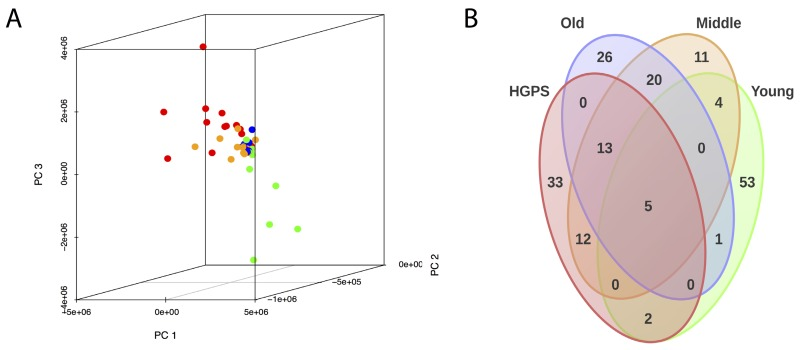
Figure 3.(A) PAS values of all samples were transformed into the first three principal components using principal component analysis (PCA). “Young”, “Middle”, “Old” and “HGPS” are depicted in green, yellow, blue and red color respectively. (B) Venn diagram representing the number of similarly up-/down-regulated pathways between “Young”, “Middle”, “Old” and “HGPS” groups. Similarity of PAS values distributions of different pathways for given groups were computed using equivalence T-test (pairwise comparison) and equivalence F-test (comparison of three and four groups).