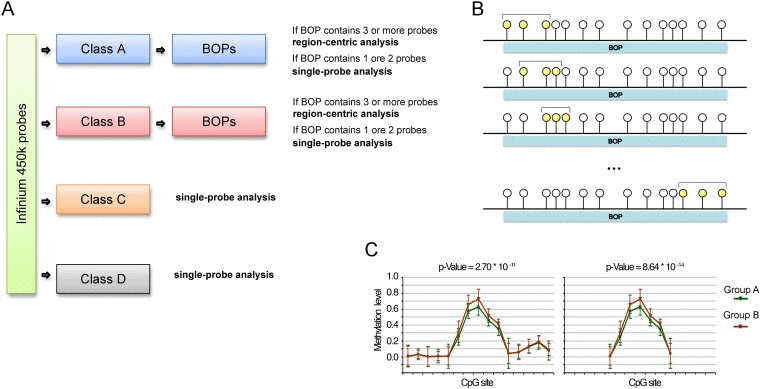
Figure 3.Proposed analytical pipeline for Infinium 450k data(A) Workflow for the use of single-probe or region-centric approaches on Infinium 450k data. (B) Graphical representation of the sliding window MANOVA used to normalize for BOPs lengths. CpG probes are represented as circles. The CpG probes considered in each round of MANOVA are highlighted in yellow. (C) Example of methylation values of CpG probes within a BOP. The BOP includes 22 CpG probes, 5 of which define a “bubble” of differential methylation between Group A and Group B. The p-value derived from MANOVA on this BOP is 2.70*10e-11. We hypothesized to have a shorter BOP including only the 5 CpG probes differentially methylated between Group A and Group B, plus a probe on both the sites whose methylation level is comparable between the two samples. In this case, although the extent of the bubble of differentially methylation is the same of the longer BOP, the p-value derived from MANOVA is lower, equal to 8.64*10e-14. This simple example shows that if we do not normalize for the length of the BOP, short BOPs tend to rank at higher positions than long BOPs.