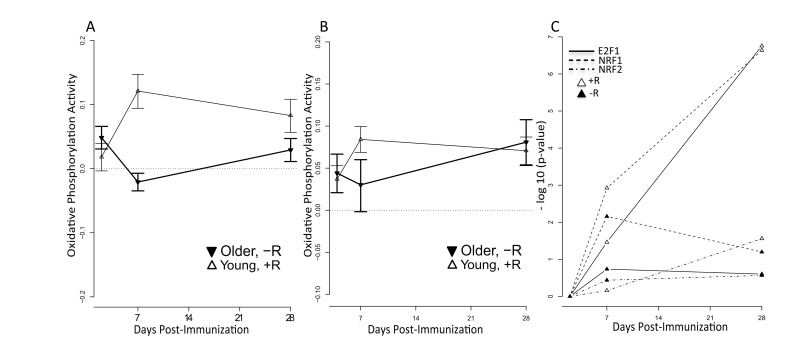
Figure 5.Increased mitochondrial activity among young vaccine respondersQuSage [34] was used to quantify activity of the KEGG oxidative phosphorylation pathway for young responders (open symbols) and older non-responders (filled symbols). +R indicates responder status and –R non-responder status. Results are shown for (A) the 2011-12 cohort and (B) the independent 2010-11 cohort. FDR values for (A) are provided in Supplementary Table 4B. For the 2010-11 cohort (B), statistically significant p values in young responders were at day 2 (p = 1.1e-05), day 7 (p = 2.3e-11), and day 28 (p = 2.4e-09) post-vaccine. For older non-responders significant p values were at day 2 (p=0.005) and day 28 (p = 2.1e-05) post-vaccine; the p value at day 7 was not significant (p > 0.05). (C) Over-representation (−log10(p-value)) of NRF1 (dashed lines), NRF2 (dash-dot lines) and E2F1 (solid lines) target genes calculated by the hypergeometric test in responders (open symbols) and non-responders (filled symbols) across time (x-axis). Target gene sets for NRF1, NRF2 and E2F1 were defined by the presence of promoter-region binding sites defined by V$NRF1_Q6, V$NRF2_Q4 and V$E2F1_Q4_01 TRANSFAC matrices, respectively. Significant p values were found for E2F1 in young responders at day 7 (FDR = 0.03) and day 28 (FDR = 1.76e-07) post-vaccine; for NRF1 in young responders at day 7 (FDR = 0.001) and day 28 (FDR = 2.3e-07) post-vaccine and in young non-responders at day 7 (FDR = 0.007) post-vaccine; and for NRF2 in young responders at day 28 (FDR = 0.03) post-vaccine. All remaining p values did not achieve statistical significance.