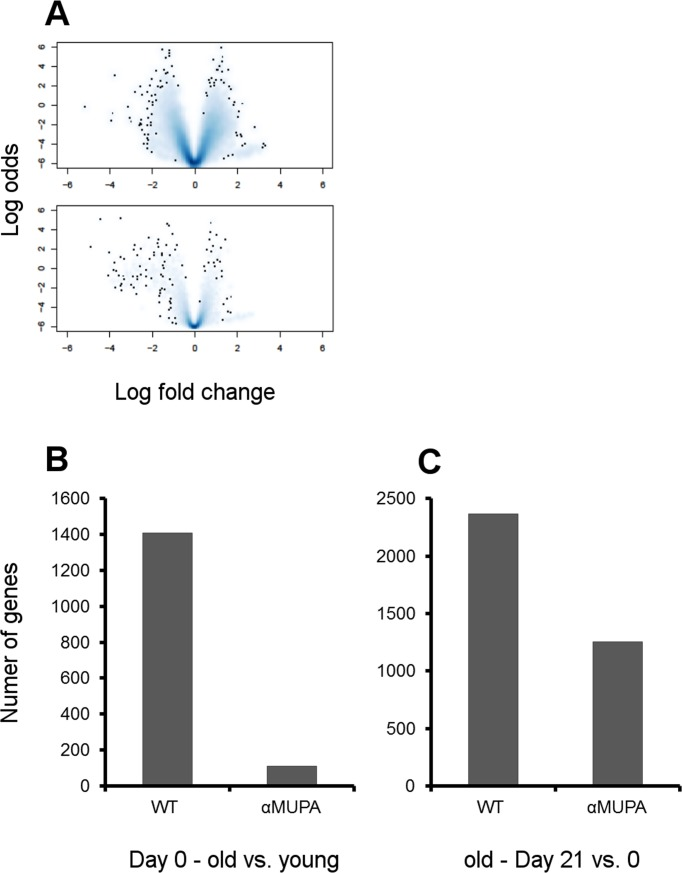
Figure 5.Age- and strain-related differences in gene expression in intact and healed skin(A) Volcano plots (effect size) of aged groups vs. young groups. Effect size was plotted as log2 of fold change vs. significance (B-value, i.e. log odds ratio of a gene being differentially expressed). Single dots represent individual genes and clouds represent multiple genes where cloud density correlates to the number of genes on the same pixel. WT – upper panel; αMUPA – lower panel. (B) The number of genes differentially expressed in aged vs. young animals at Day 0 (intact skin) (p < 0.05). (C) The number of genes differentially expressed in the skin of aged animals after histologically confirmed full closure of the wound (Day 21 vs. Day 0; p < 0.05).