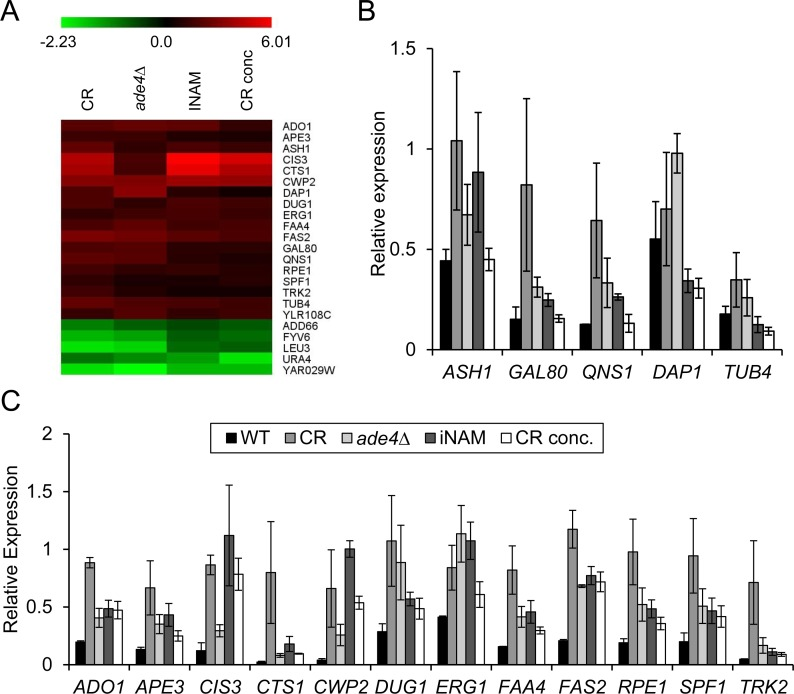
Figure 5.Comparative microarray analysis reveals potential biomarkers of CLS(A) Heat map of log2 fold-expression changes of 23 genes that are differentially regulated in all the long-lived condition when compared to WT non-restricted cultures. (B) qRT-PCR of expression changes for 5 genes from the upregulated class that could not be confirmed as statistically changed in all 4 conditions. (C) qRT-PCR of expression changes for the 12 genes shown to be significantly upregulated at day 8 (p<0.05). All qRT-PCR data was normalized to ACT1 transcript levels.