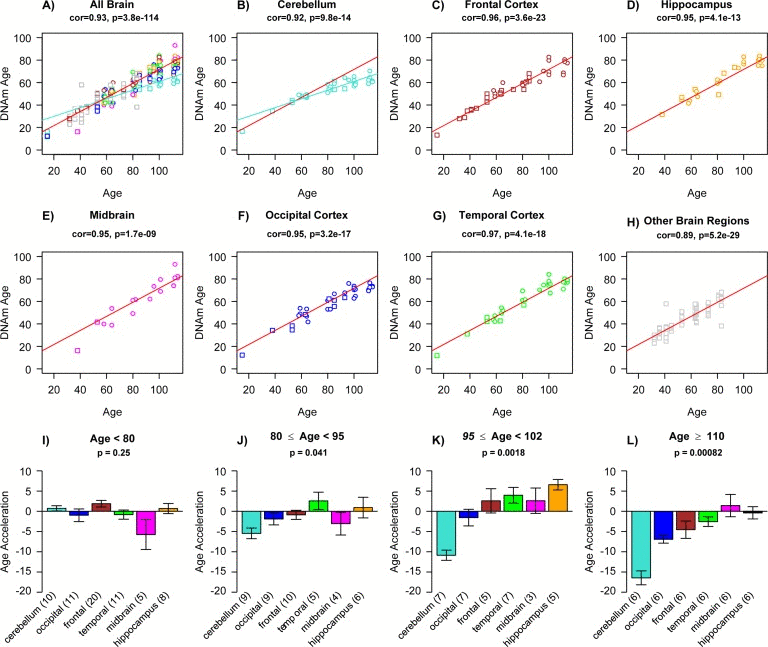
Figure 2.Epigenetic age acceleration in various brain regions(a) Scatter plot relating the DNAm age of each brain sample (y-axis) versus the corresponding chronological age (x-axis). Points are colored by brain regions (e.g. turquoise for cerebellum) as indicated in (b-h). Linear regression lines through cerebellar samples and non-cerebellar samples are colored in turquoise and red, respectively. Note that cerebellar samples (turquoise points) exhibit a lower rate of change (i.e. slope of the turquoise line) than non-cerebellar samples. In the scatter plots, circles and squares correspond to brain regions from Alzheimer's disease subjects and controls, respectively. Scatter plots show (b) cerebellar samples only, (c) frontal lobe, (d) hippocampus, (e) midbrain, (f) occipital cortex, (g) temporal cortex, and (h) remaining brain regions, which include caudate nucleus, cingulate gyrus, motor cortex, sensory cortex and parietal cortex. The subtitle of each scatter plot reports a Pearson correlation coefficient and corresponding p-value. Epigenetic age acceleration was defined as the vertical distance of each sample from the red regression line in (a). (i-l) Age acceleration versus brain region in different age groups as indicated in the respective titles. Cerebellar samples tend have the lowest (negative) age acceleration (turquoise bars) followed by occipital cortex (blue bars). Each bar plot depicts the mean value and one standard error and reports a non-parametric group comparison test p-value (Kruskal Wallis Test).