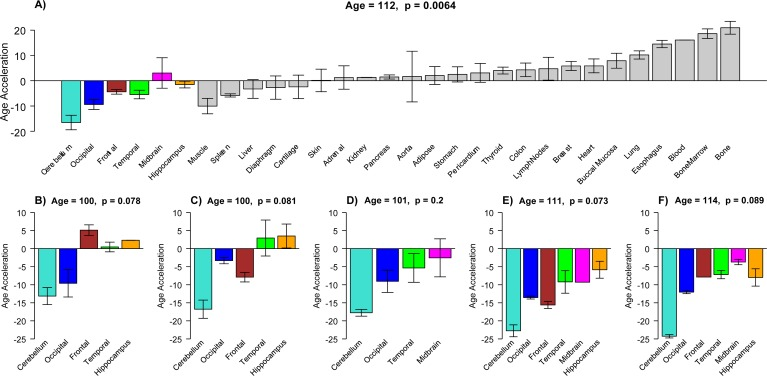
Figure 3.Epigenetic age acceleration in tissues from individual centenarians(a) Mean DNAm age acceleration per tissue (y-axis) for the 30 tissues and organs collected from a 112 year old woman. (b-f) Age acceleration in brain regions of 5 additional centenarians (whose age is in the title). Age acceleration here is defined relative to age of non-cerebellar brain samples as indicated by the red regression line in Figure 2a. Bars corresponding to different brain regions are colored as in Figure 2. For each of the six centenarians, cerebellar samples (turquoise bars) take on the lowest (negative values). Each bar plot reports the mean value and one standard error. Number of replicate measurements for each tissue was two except for bone and bone marrow, which were four.