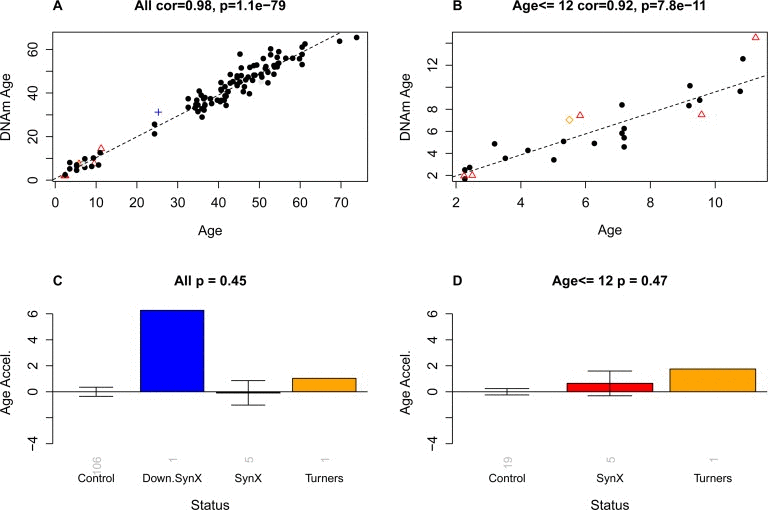
Figure 3.Epigenetic age versus chronological age and disease statusThe first row (A,B) shows scatter plots between chronological age (x-axis) and DNAm age (y-axis) in (A) all subjects and (B) in subjects younger than or equal to 12. Red triangles indicate the pure syndrome X subjects. The blue cross and the orange diamond correspond to the Down syndrome and Turner syndrome case, respectively. The dashed black line corresponds to a regression line through control subjects. Note that the red triangles do not lie below the regression line, i.e. there is no evidence that these subjects are younger than expected. For each subject, a measure of epigenetic age acceleration was defined as vertical distance between the corresponding point and the regression line in the scatter plot. (C,D) Mean epigenetic age acceleration (y-axis) versus disease status in (C) all subjects and (D) younger subjects, respectively. By definition, the mean age acceleration measure in controls is zero. The title of the bar plots also reports a p-value from a non-parametric group comparison test (Kruskal Wallis test). Each bar plot depicts the mean value and 1 standard error.