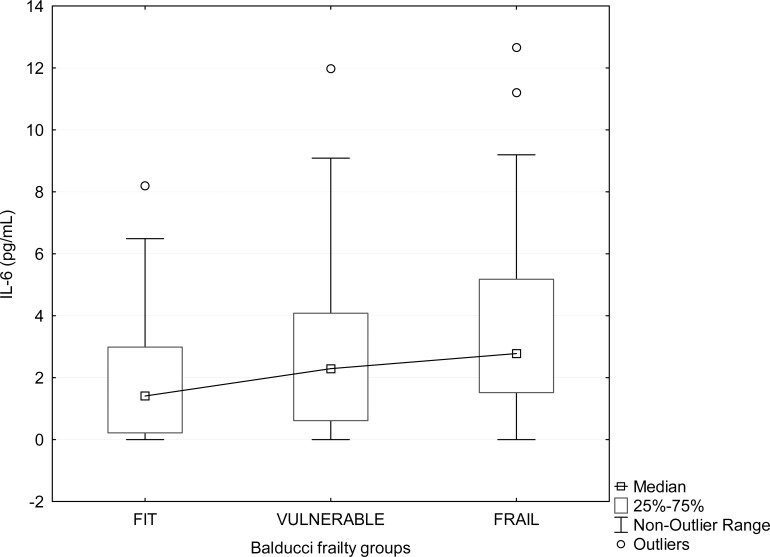
Figure 2.Boxplot showing the relation between plasma IL-6 and frailty status determined by Balducci Frailty Score. Frailty groups according to Balducci's test are displayed on the X axis. In each group, some extreme values are not shown for graphical reasons (2 values in ‘fit’, 2 values in ‘vulnerable’, and 8 values in ‘frail’ group).