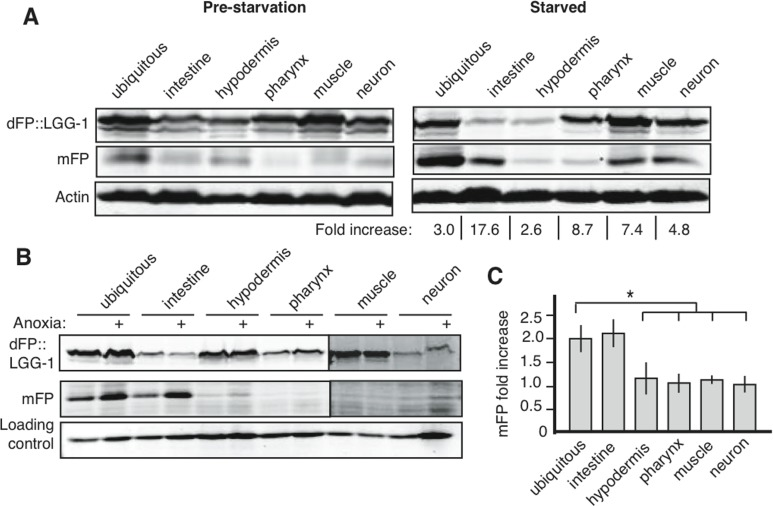
Figure 4.Starvation and anoxia induce different patterns of autophagy upregulation(A) Animals lysed at L1, before starvation, showed low levels of basal autophagy (left panel, and band intensities quantified in Supplementary Table 1). After 5 days of starvation there was an increase in mFP in all tissues (right panel). Fold increase indicates change in normalized mFP after starvation. Representative gel is shown but experiments consistently showed the largest increases in intestine, muscles and neurons, with a positive but smaller fold increase in other tissues. (B) Exposing nematodes to 18 hours of anoxia at mid-larval stage (L2/L3) causes an increase in autophagic flux in the intestine but does not affect mFP levels in other tissues. All lanes are from the same experiment run in the same SDS-PAGE gel, with delineations indicating areas of the image that were separately adjusted for brightness and contrast for the sake of clarity (uncropped immunoblots shown in Supplementary Figure 1). (C) A graph of the average fold change of normalized mFP in each tissue after anoxia. N=3-7, asterisk indicates p<0.05 for the mFP ratio of the ubiquitous reporter compared to the mFP ratio in the hypodermis, pharnynx or muscle, and p<0.06 for a comparison of the mFP ratios in ubiquitous and neuronal expression. The ubiquitous and intestinal reporters were statistically similar (p=0.8).