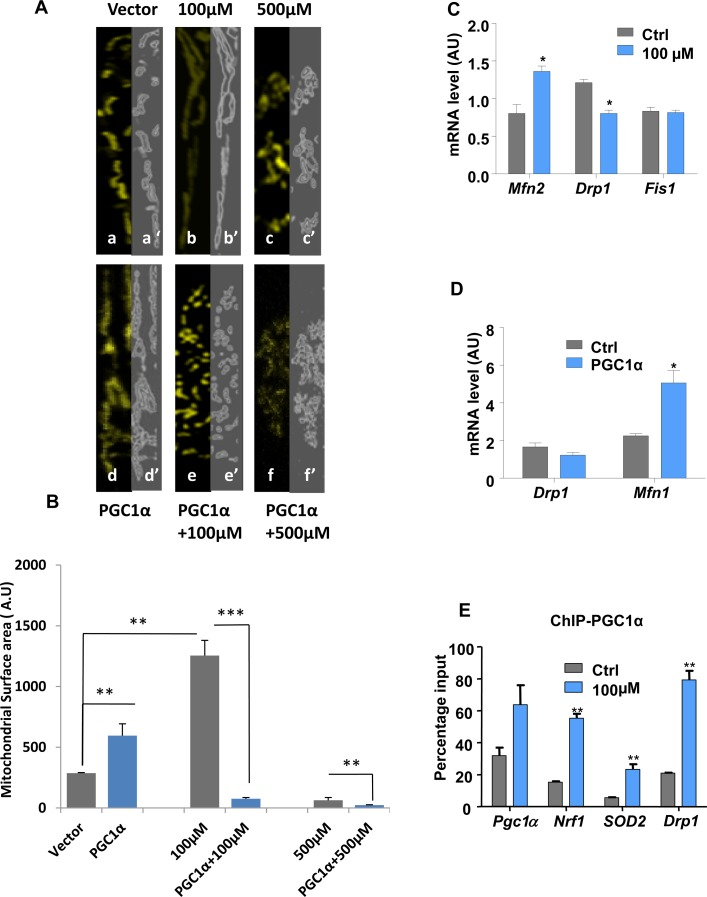
Figure 3.Lead-induced changes in mitochondrial morphology and dynamicsImmunocytochemistry and confocal imaging analysis of N27 cells co-transfected with an empty vector and mitoYFP (A, a-c) or PGC1α-encoding vector and mitoYFP (A, d-f). The extent of the mitochondrial network both under basal conditions (a), Pb2+ 100μM (b), Pb2+ 500μM (c) and PGC1α overexpression alone (d) or combined with Pb2+ 100μM (e) or 500 μM (f) was measured by Spectrum. (A, a’-f’) mitochondrial area surface determined using ImageJ->threshold->Intermodes,(B,W). (B) Mitochondrial surface area in cells was determined using ImageJ software.(C) N27 cells treated with 100μM lead for 48-hours were analysed for the expression of mitochondrial fusion (Mfn2) and fission (Drp1, Fis1) genes by qRT-PCR. (D) qRT-PCR analysis of the expression of Drp1 and Mfn1 in PGC1α overexpressing cells.(E) Chromatin immunoprecipitation (ChIP) with a PGC1α antibody was performed to investigate PGC1α protein binding to its promoter, Nrf1, Drp1 and SOD2 gene promoters,*P<0.05, **P<0.01, ***P<0.001, n=3; mean ± SE.