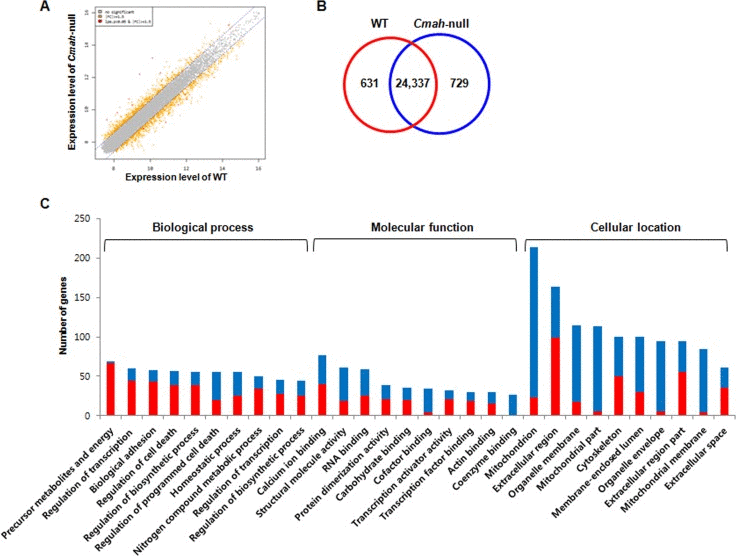
Figure 2.Gene expression profile in cochlea of Cmah -null mice(A) Scatterplot of normalized mRNA expression by microarray. Data are log2 normalized. Grey- and orange-spots indicate no significant genes and up- or down-regulated genes, with more than 1.5-fold change. (B) Venn diagram showing differential expression of genes in the cochlear tissues of Cmah-null mice. Numbers in red and blue Venn diagram present up- and down-regulated genes, respectively. (C) The differentially up- or down-regulated genes were clarified according to biological process, molecular function, and cellular component. GO classification significantly enriched with a Benjamini-Hochberg corrected P value < 0.05 among all differentially expressed genes with ≥ 1.5-fold expression between WT- and Cmah-null mice.