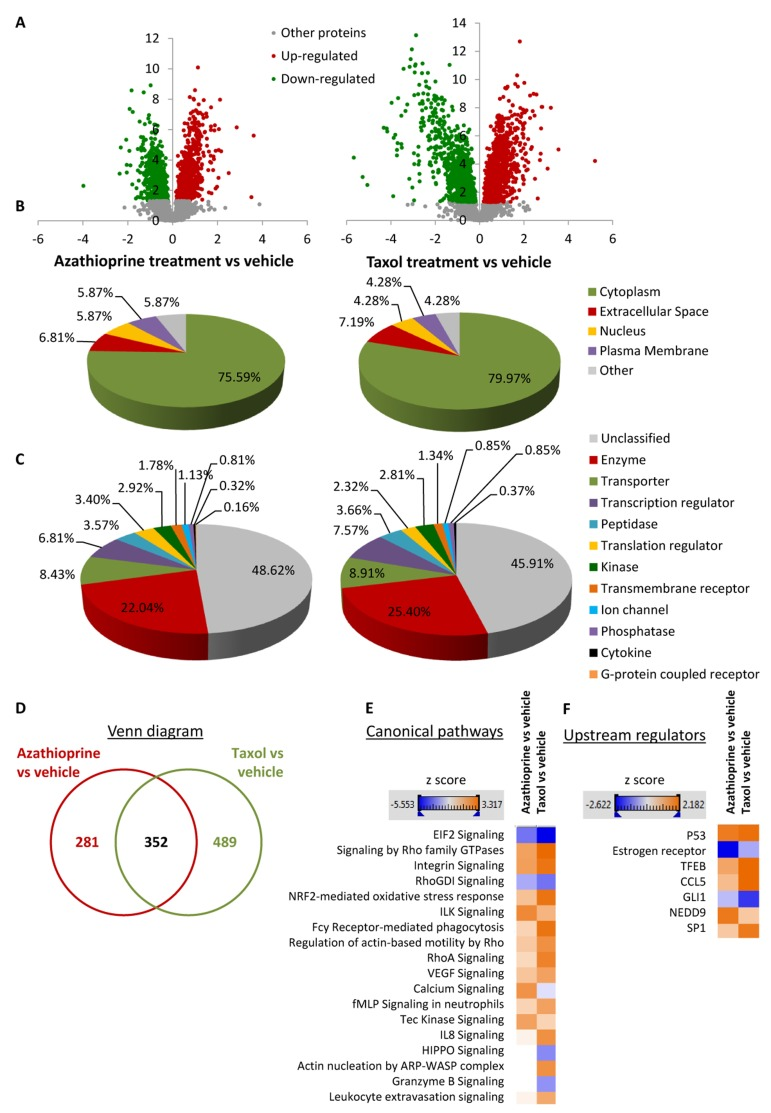
Figure 3.Overview of proteins and pathways identified as differentially regulated in the lysates of azathioprinetreated and taxol-treated fibroblasts relative to vehicle by Ingenuity Pathway Analysis(A) Volcano plot representation of protein abundance changes in hTERT-BJ1 fibroblasts upon treatment with azathioprine and taxol compared to vehicle treatment. A total of 1640 differentially regulated proteins with fold changes ≥ 1.15 and p values < 0.05 were identified in azathioprine-treated fibroblasts, and 2967 differentially regulated proteins in taxol-treated fibroblasts. X axis represents log2(fold change). Y axis represents −log(p value). Non-significantly regulated proteins are shown in grey, in green, significantly down-regulated proteins and in red, significantly up-regulated proteins. (B) Subcellular localization of differentially regulated proteins identified in azathioprine and taxol treatments compared to vehicle treatment. (C) Classification of differentially regulated proteins identified in azathioprine and taxol treatments by type. Cellular enzymes account for 22.04% and 25.40% of total differentially regulated proteins identified in azathioprine treatment and taxol treatment, respectively. (D) Overlap of differentially regulated proteins identified in azathioprine and taxol treatments compared to vehicle treatment. Of all proteins identified by quantitative proteomics, 352 were proteins the expression of which was found altered in both treatments compared to vehicle. (E) Canonical pathways and (F) upstream regulators identified or predicted as altered in both treatment conditions compared to vehicle. A positive z score is indicated in orange and points towards an activation of the pathway, and a negative z score, in blue, indicates an inhibition of the pathway.