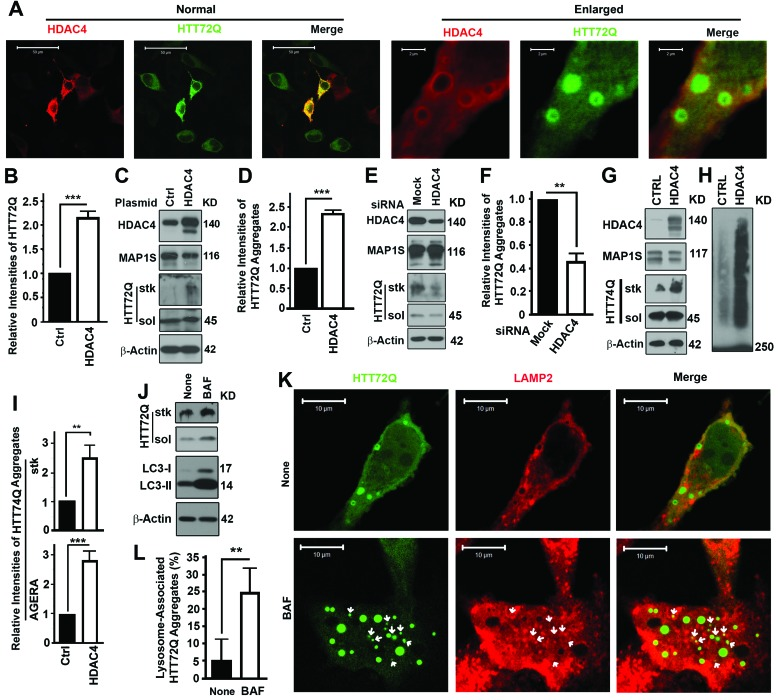
Figure 1.Inhibition of HDAC4 reduces mHTT aggregates(A-D) Overexpression of HDAC4 increases levels of GFP-HTT72Q (HTT72Q) in HeLa cells stably expressing HTT72Q. Representative fluorescent images (A) and immunoblot results (C) and their respective quantification (B,D) are shown. Bars in (A) were 50 or 2 μm in the normal view on the left half and enlarged view on the right. HTT72Q aggregates retained in stacking gel (stk) and soluble HTT72Q (sol) were labeled. Data here or throughout are the average ± standard deviation of at least three repeats. Statistical significance was determined by Student's t-test. *, p ≤ 0.05; **, P ≤ 0.01; and ***, P ≤ 0.001. The 45 KD HTT72Q formed aggregates that failed to penetrate stacking gel. (E, F) Suppression of HDAC4 decreases levels of HTT72Q aggregates in HeLa cells stably expressing HTT72Q. Representative results of immunoblots (E) and quantification (F) when HDAC4 is suppressed with siRNA are shown. (G-I) Overexpression of HDAC4 increases levels of GFP-HTT74Q (HTT74Q) in N2a cells transiently expressing HTT74Q. Representative results from normal immunoblot analyses of aggregates in stacking gel (G) or AGERA (H) and their respective quantification (I) were shown. (J) Lysosomal inhibitor Bafilomycin A1 (BAF) causes accumulation of both HTT72Q and LC3-II in cells expressing HTT72Q. None, without BAF. (K, L) HTT72Q aggregates colocalize with LAMP2-labelled lysosomes (red) in cells stably expressing HTT72Q and transiently expressing Flag-HDAC4 in the presence of BAF. Representative fluorescent images are shown and white arrows indicate HTT72Q aggregates that colocalize with LAMP2 (K). Statistical significance of difference in the percentages of HTT72Q aggregates associated with LAMP2-labelled lysosomes to total aggregates was assessed between control and BAF-treated cells (I).