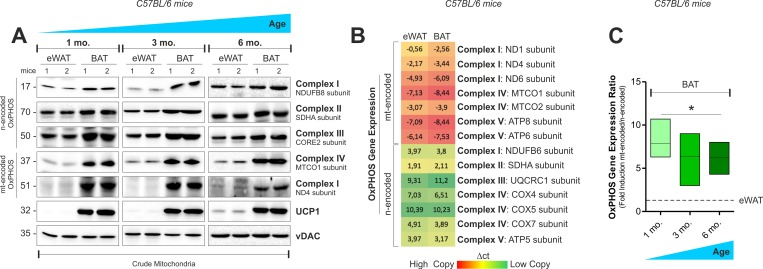
Figure 1.OxPHOS gene expression in mouse white and brown fat(A) mtDNA and nDNA-encoded OxPHOS proteins analyzed by Western blot (n=2 mice per group). (B) Heat map of mtDNA-and nDNA-encoded OxPHOS genes assayed by RT-qPCR in 4 months old mice (mean value of n=4 mice per group). (C) OxPHOS gene expression ratio evaluated by calculating the ratio between mtDNA-and nDNA-encoded OxPHOS genes considered in (B) (n=4 mice per group). vDAC served as loading control. Bar graphs are expressed as mean ±S.D. (*p<0.05 vs eWAT).