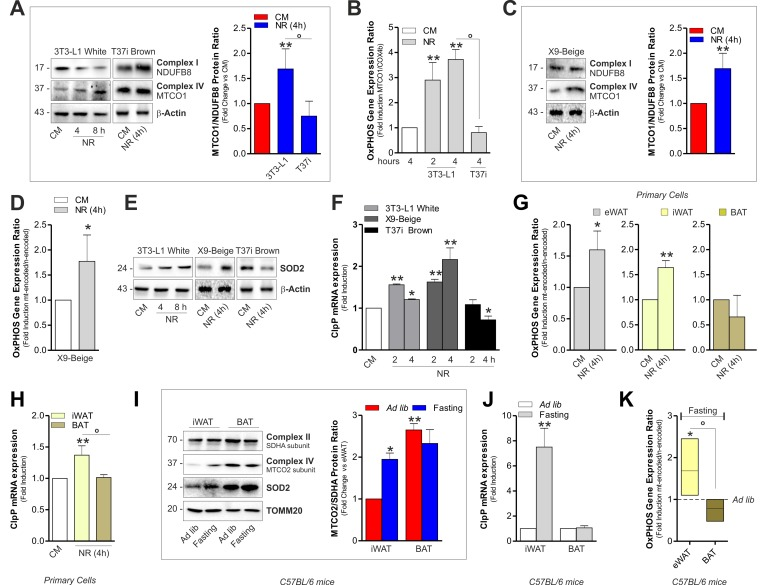
Figure 2.Mitonuclear OxPHOS imbalance and mitochondrial stress response is elicited in white and beige adipocytes upon starvation(A) OxPHOS protein ratio (right panel) evaluated by calculating the ratio between mtDNA-and nDNA-encoded OxPHOS proteins after Western blot (left panel) followed by densitometric analysis. (B) OxPHOS gene expression ratio evaluated by RT-qPCR. (C) OxPHOS protein ratio evaluated as described in (A). (D) OxPHOS gene expression ratio evaluated by calculating the ratio between mtDNA-(MTCO1 and ATP6) and nDNA-encoded (SDHA and Cox4b) OxPHOS mRNAs. (E, F) Mitochondrial stress response assessed by Western blot analysis of SOD2 (E) and through RT-qPCR of ClpP (F). (G) OxPHOS gene expression ratio evaluated as described in (D). (H) mRNA levels of ClpP measured by RT-qPCR. (I, J) OxPHOS protein ratio (I, left panel) evaluated as described in (A). SOD2 protein (I) and mRNA levels of ClpP (J) evaluated by Western blot and RT-qPCR, respectively (n=4 mice per group). (K) OxPHOS gene expression ratio evaluated as described in (D) (n=4 mice per group). Actin and TOMM20 served as loading controls. Bar graphs are expressed as mean ±S.D. (n=4; *p<0.05; **p<0.01 vs CM or ad libitum fed mice; °p<0.05). NR: nutrient restriction; CM: complete medium.