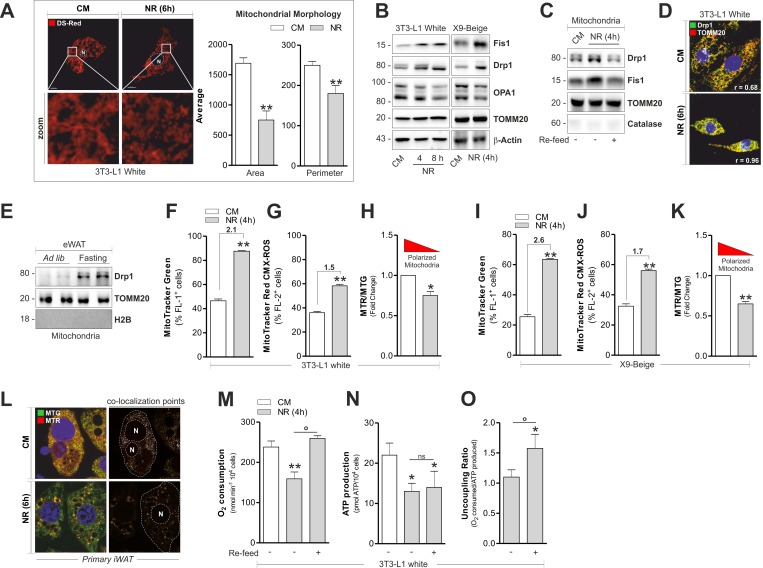
Figure 3.Fragmentation and altered functionality occurs in mitochondria of white and beige adipose cells after starvation(A-C) Mitochondrial fragmentation assessed by analyzing mitochondrial morphology through confocal microscopy in cells transfected with mitochondrial Ds-Red fluorescent protein (A) or by analyzing the content of Drp1, Fis1 and OPA1 through Western blot (B, C). (D) Fragmented mitochondria detected through confocal microscopy after co-staining with Drp1 and TOMM20 antibodies. (E) Mitochondrial fragmentation assessed as described in (B) in crude mitochondria (n=4 mice per group). (F-K) Mitochondrial amount and membrane potential quantified by MitoTracker Green (F, I) and MitoTracker Red CMX-ROS (G, J) by cytofluorimetric analysis, respectively. Polarized mitochondria determined by calculating Red-to-Green ratio (MTR/MTG) (H, K). (L) Polarized mitochondria detected through confocal microscopy after staining with MitoTracker Green and MitoTracker Red CMX-ROS. Co-localization points indicate polarized mitochondria. (M-O) Polarographic recording of oxygen consumption (M) and cheminoluminescent assay of ATP content (N) under NR and 1h after nutrient refill (Re-feed) with complete culture medium. Mitochondrial uncoupling determined by calculating the ratio between O2 consumption and ATP production (O). Bar graphs are expressed as mean ±S.D. (n=3; *p<0.05; **p<0.01 vs CM; °p<0.05). Actin, TOMM20, H2B and catalase staining served as loading controls or for assessing the purity of cell protein fractions. NR: nutrient restriction; CM: complete medium.