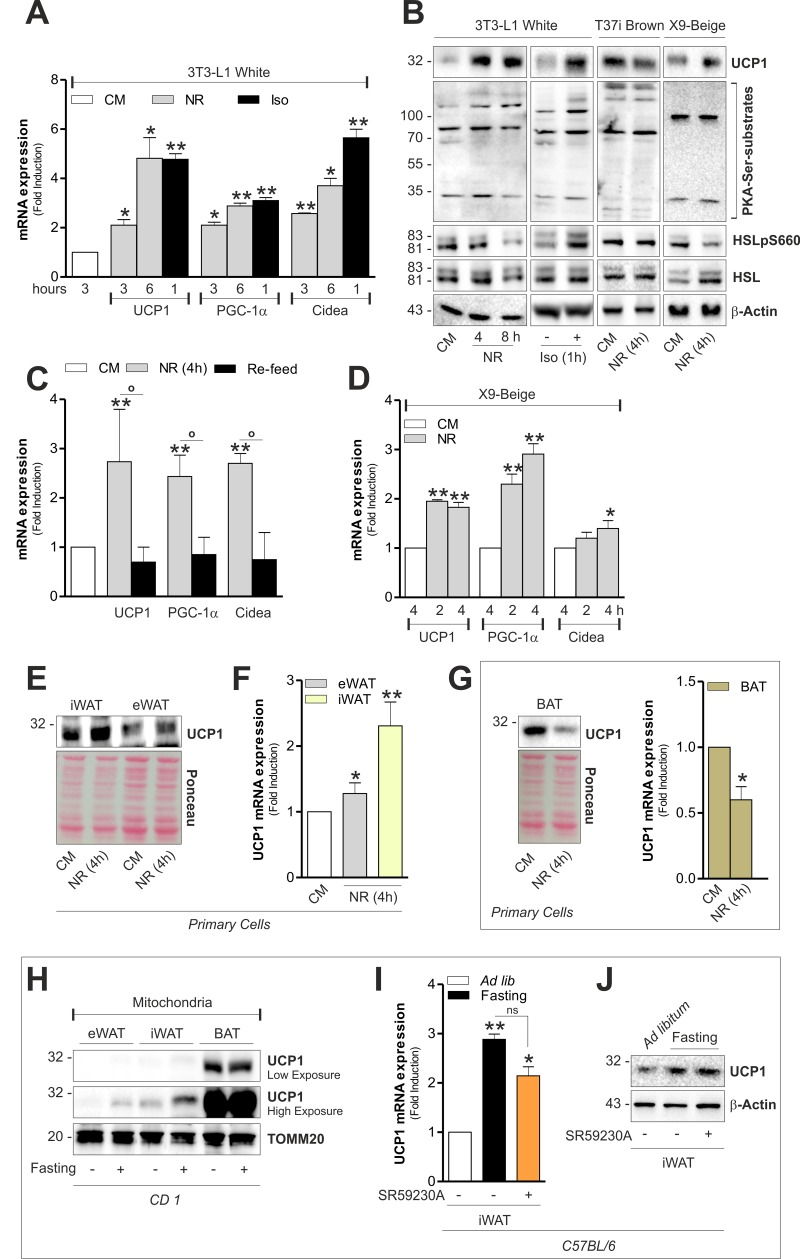
Figure 4.White and beige adipose cells undergo brown fat-like changes independently of hormones(A) Induction of brown-related genes evaluated by analyzing the mRNA expression of UCP1, PGC-1α and Cidea through RT-qPCR. (B) Protein level of UCP1, HSL, phospho-active HSL (HSLpS660) and PKA serine substrates assayed through Western blot analysis in total cell lysates. (C) Induction of brown-related genes evaluated as described in (A) after 1h nutrient refill with complete culture medium (Re-feed). (D) Induction of brown-related genes evaluated as described in (A). (E-G) UCP1 protein and mRNA levels measured by Western blot (E, G) and RT-qPCR (F, G) analysis. (H) UCP1 protein level analyzed by Western blot in crude mitochondria (pool of n=6 mice per group). (I, J) UCP1 mRNA (I) and protein (J) levels measured by RT-qPCR and Western blot analysis (n=6 mice per group). Actin, TOMM20 and Ponceau Red staining served as loading controls. Bar graphs are expressed as mean ±S.D. (n=4; *p<0.05; **p<0.01 vs CM or ad libitum fed mice; °p<0.05). NR: nutrient restriction; CM: complete medium; Iso: isoproterenol.