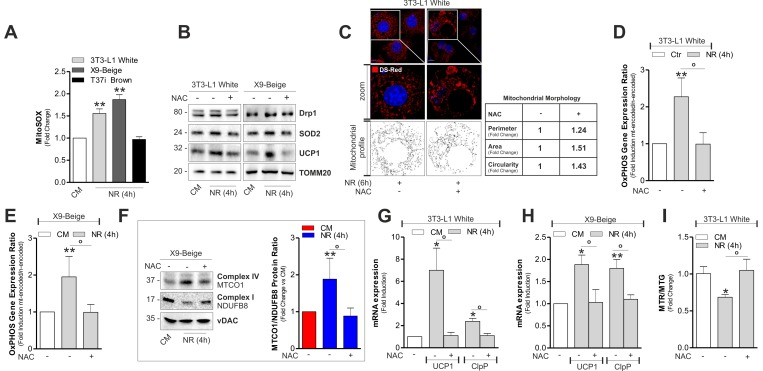
Figure 5.mtROS are involved in the induction of mitonuclear stress response and uncoupling(A) Cytofluorimetric detection of mtROS after staining with MitoSOX. (B) Protein levels of Drp1, SOD2 and UCP1 analyzed by Western blot. (C) Mitochondrial fragmentation detected through confocal microscopy in cells transfected with mitochondrial Ds-Red fluorescent protein and treated or not with NAC. (D, E) OxPHOS gene expression ratio evaluated by calculating the ratio between mtDNA-encoded (MTCO1 and ATP6) and nDNA-encoded (SDHA and Cox4b) mitochondrial mRNAs after RT-qPCR in cells treated or not with NAC. (F) OxPHOS protein ratio (right panel) evaluated by calculating the ratio between mtDNA-encoded (MTCO1) and nDNA-encoded (NDUFB8) mitochondrial proteins (left panel) after Western blot followed by densitometric analysis. (G, H) mRNA levels of UCP1 and ClpP measured through RT-qPCR in cells treated or not with NAC. (I) Cytofluorimetric detection of mitochondrial amount and membrane potential through MitoTracker Green (MTG) and MitoTracker Red CMX-ROS (MTR) staining, respectively. Polarized mitochondria determined by calculating Red-to-Green ratio (MTR/MTG). TOMM20 and vDAC staining served as loading control. Bar graphs are expressed as mean ±S.D. (n=4; *p<0.05; **p<0.01 vs CM; °p<0.05). NR: nutrient restriction; CM: complete medium.