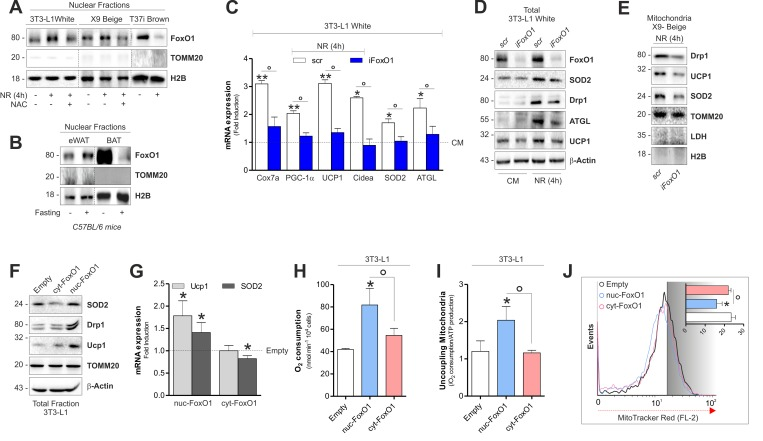
Figure 6.FoxO1 modulates mitochondrial stress response and expression of brown-related genes in white and beige adipose cells(A) Protein levels of FoxO1 analyzed by Western blot in nuclear fractions of starved adipocytes treated or not with NAC. (B) Protein levels of FoxO1 analyzed by Western blot in nuclear fractions (n=4 mice per group). (C-E) mRNA (C) and protein (D, E) levels of brown fat-related genes analyzed by RT-qPCR or Western blot in starved cells transfected with a scramble or FoxO1 RNAi. (F, G) Protein (F) and mRNA (G) expression levels of brown fat-related genes analyzed by Western blot or RT-qPCR in cells transfected with plasmids containing nuc-FoxO1 or cyt-FoxO1 cDNAs. (H, I) Polarographic recording of oxygen consumption (H) and cheminoluminescence assay of ATP content (I) in cells transfected with plasmids containing nuc-FoxO1 or cyt-FoxO1 cDNAs. Mitochondrial oxidative phosphorylation efficiency determined by calculating the ratio between ATP production and O2 consumption (P:O ratio). (J) Cytofluorimetric detection of mitochondrial membrane potential after staining cells with MitoTracker Red CMX-ROS. Actin, H2B, TOMM20 and LDH staining served as loading control. Bar graphs are expressed as mean ±S.D. (n=4; *p<0.05 vs CM or Empty; **p<0.01 vs CM; °p<0.05). NR: nutrient restriction; CM: complete medium.