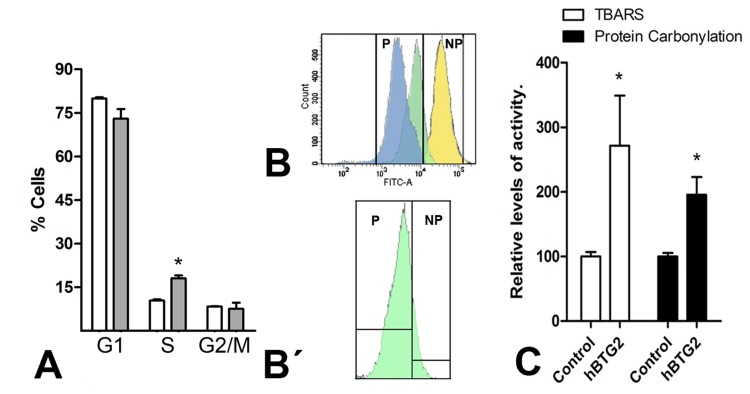
Figure 3.(A) Graphic illustrations comparing the proportion of cells at different cell cycle stages in control (white columns) versus Btg2-overexpressing mesodermal progenitors (grey columns) after 48 hr of culture as evaluated using flow cytometry after PI staining. (B-B′) Illustrates the dilution of CFSE labeling after 48 hr of culture in a representative sample of three distinct experiments. Blue: control cells; Green: Btg2 overexpressing; Yellow: control cells maintained at 4°C. NP (non-proliferating) marks the area of the plot of no proliferation, deduced from the absence of CFSE dilution in control cells maintained at 4°C. P (proliferating) marks the area of the cytometry plot of cells in proliferation. The lower dilution of CFSE in the proliferating cell population (P) of Btg2-overexpressing cells (green) in comparison with control cells (blue) indicates a reduced proliferation rate. B′: detailed view of the Btg2-overexpressing cells in B, isolated from the other values to appreciate that a significant portion (15%) of experimental cells are non-proliferating. (C) Graphic representation of the levels of lipid oxidation and carbonylated proteins in control and Btg2-overexpressing limb mesodermal progenitors. * p< 0.05.