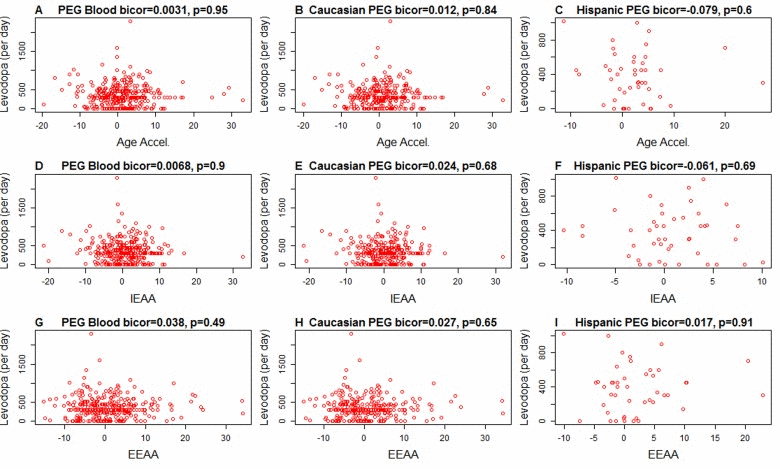
Figure 2.Levodopa medication (x-axis) versus epigenetic age acceleration in PD subjectsEach scatter plot depicts the amount of levodopa medication (milligram per day) versus (A,B,C) universal epigenetic age acceleration, (D,E,F) intrinsic epigenetic age acceleration (G,H,I), extrinsic epigenetic age acceleration. The first, second, and third column correspond to all subjects, Caucasians only, and Hispanics only, respectively. Each dot (PD patient) is colored in red for the sake of consistency with Figure 1. The heading of each plot reports a robust correlation coefficient (biweight midcorrelation and a corresponding p-value).
Figure 2 — Increased epigenetic age and granulocyte counts in the blood of Parkinson's disease patients | Aging