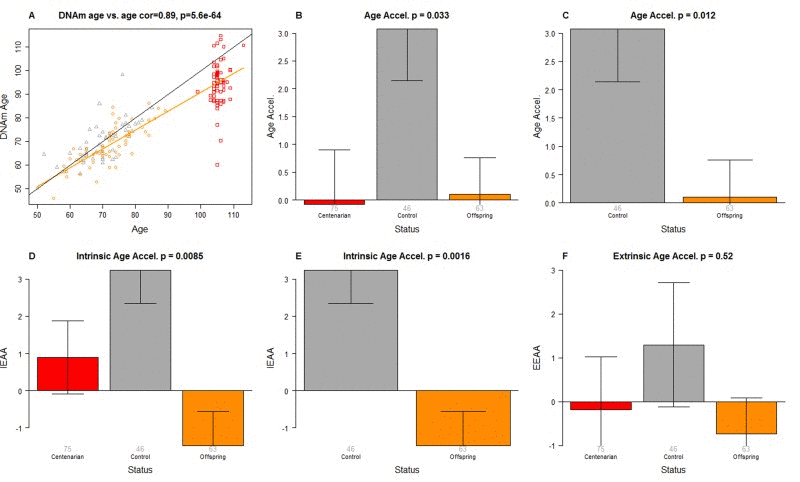
Figure 1.Epigenetic age analysis of PBMCs from centenarians and controls(A) Scatter plot relating the DNAm age of each PBMC sample (y-axis) versus chronological age (x-axis). Points are colored by status. The color of each dot corresponds to the status of each PBMC sample: red for centenarians, orange for offspring of centenarians, grey for controls. The black line corresponds to y=x. The orange line depicts the regression line based on the offspring of centenarians and centenarians (orange and red dots). The vertical distance to the orange line corresponds to the universal measure of age acceleration Age Accel. The bar plots depict group status (x-axis) versus (B, C) universal age acceleration, (D, E) intrinsic age acceleration, (F) extrinsic age acceleration. Each bar plot depicts the mean value, one standard error, and reports the p-value results from a non-parametric group comparison test (Kruskal Wallis test).