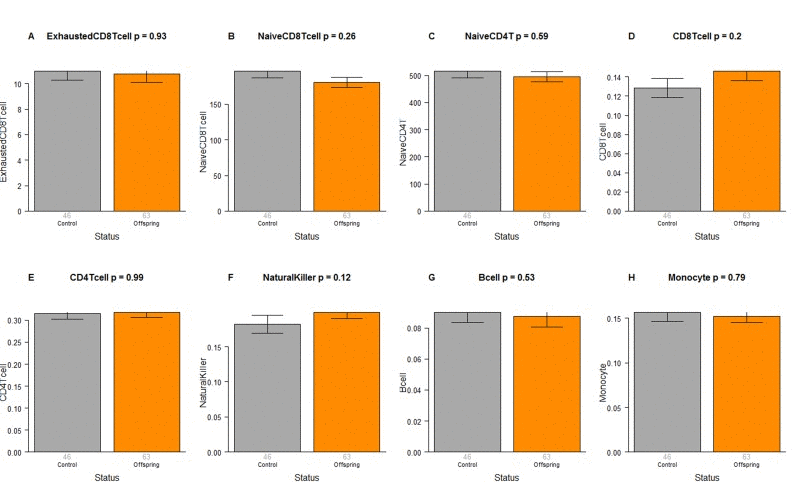
Figure 2.Blood cell counts in offspring of semi-supercentenarians versus age matched controlsGroup status (offspring of semi-supercentenarian or control) versus estimated abundance of (A) exhausted cytotoxic T cells, (B) naïve cytotoxic T cells, (C) naïve helper T cells, (D) cytotoxic T cells, (E) helper T cells, (F) natural killer cells, (G) B cells, (H) monocytes. Each bar plot reports the mean value and one standard error. The p-value results from a non-parametric group comparison test (Kruskal Wallis). The abundance measures of blood cell counts were estimated based on DNA methylation levels using the epigenetic clock software. Roughly speaking, the y-axis of (A) reports a percentage while that for (B, C) corresponds to counts but it is best to interpret the y-axis in (A-C) as ordinal abundance measure. The y-axis in (D-H) reports estimated proportions based on the Houseman method [78].