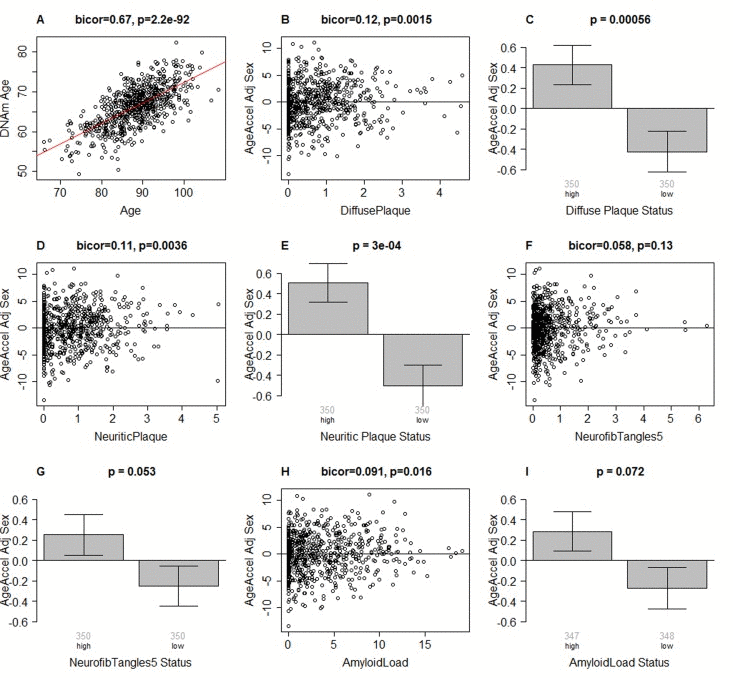
Figure 1.Epigenetic age of DLPFC samples versus neuropathological measures(A) Scatter plot relating the DNAm age of each PFC sample (y-axis) versus chronological age at time of death (x-axis). The red line depicts a linear regression line. The y-axis of the remaining panels (B-I) involves the measure of epigenetic age acceleration which has been adjusted for sex. The scatter plots relate epigenetic age acceleration (y-axis) to (B) diffuse plaques, (D) neuritic plaques, (F) NFTs, and (H) amyloid load. The title of each scatter plot reports a robust correlation coefficient (biweight midcorrelation) and a corresponding p-value. (C,E,G,I) The x-axis of the bar plots involve a binary grouping variable that results from using the median value for dichotomizing (C) diffuse plaques, (E) neuritic plaques, (G) NFT, and (I) beta-amyloid load, respectively. Each bar plot depicts the mean value, one standard error, and reports the p-value results from a non-parametric group comparison test (Kruskal Wallis test). The title of each scatter plot reports a robust correlation coefficient (biweight midcorrelation) and a corresponding p-value.