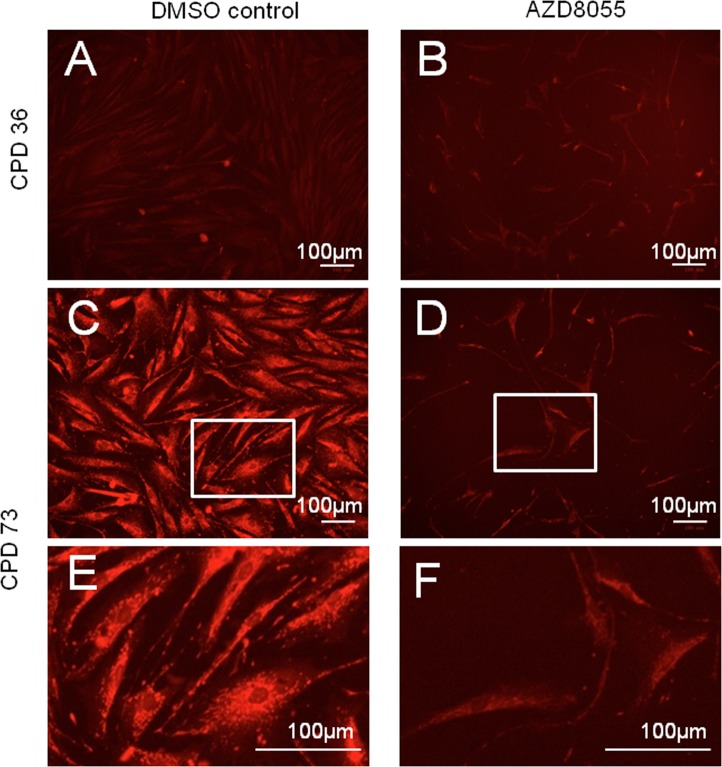
Figure 2.Decreased senescence-related mitochondrial signal on AZD8055 treatmentFibroblasts were incubated with DMSO (A, C, E) or AZD8055 (B, D, F) for 7 days prior to staining with MitoTracker Red and imaging with a BioRad Zoe fluorescent imager. (A, B) show cells at early stages of culture (CPD 36), while C-F show cells at CPD 73 at time of drug treatment. (E, F) are magnified from C, D (respectively, region magnified shown by white box). Scale bar 100 μm. Note that gain and exposure time were the same in all photomicrographs.