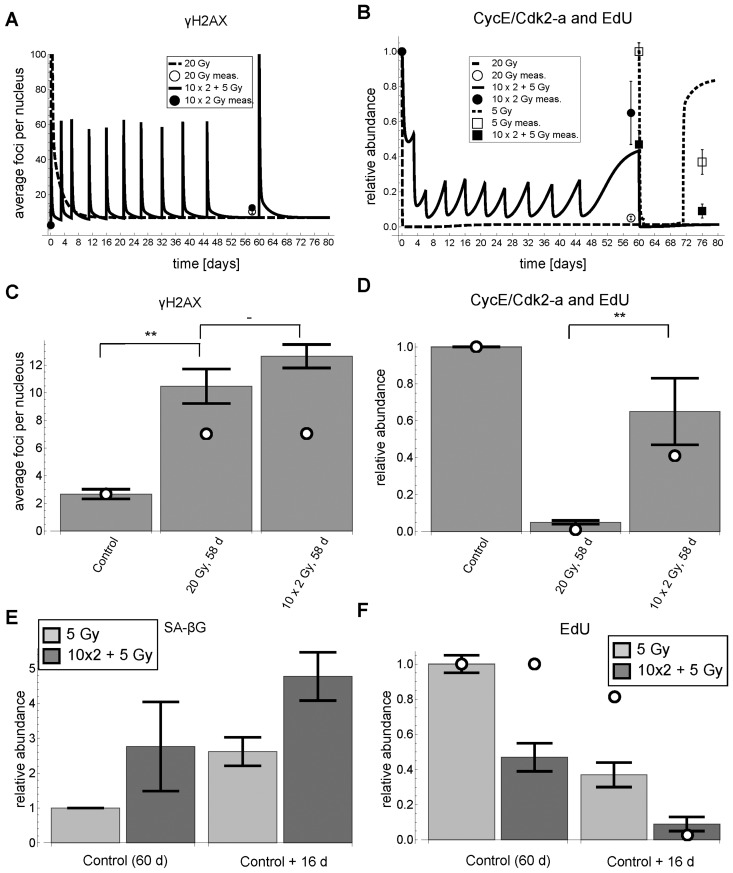
Figure 7.γH2AX foci, EdU incorporation and SA-βG after cumulative DNA damage. (A) Simulated (lines) and measured (symbols) time series of γH2AX foci (mean ± average SEM (3 rep with >50 nuclei each)), respectively. For better visibility of the cumulative damage, the y-axis was pruned at 100 foci. (B) Simulated (lines) and measured (symbols) time series of simulated Cdk2 activity (CycE/Cdk2-a) and measured EdU incorporation (mean ± SEM (n≥3)), respectively. (C) Simulated (open circles) and measured (bars) γH2AX foci 58 days after experiment start (Control) (mean ± average SEM (3 rep with >50 nuclei each)). White dots indicate simulated values from panel A. (D) Simulated Cdk2 activity (CycE/Cdk2-a) (open circles) and EdU incorporation (bars) (mean ± SEM (n≥3)) 58 days after experiment start (Control), respectively. White dots indicate simulated values from panel B. (E) SA-βG activity (mean ± SEM (n≥3)) after 5 Gy IR and 10×2+5 Gy IR 16 days after control (60 days), respectively. (F) EdU incorporation after 5 Gy IR and 10×2+5 Gy IR 16 days after control (60 days), respectively (mean ± SEM (n≥3)). **: P<0.05, -: P>0.1, non-paired two-sided t-test.