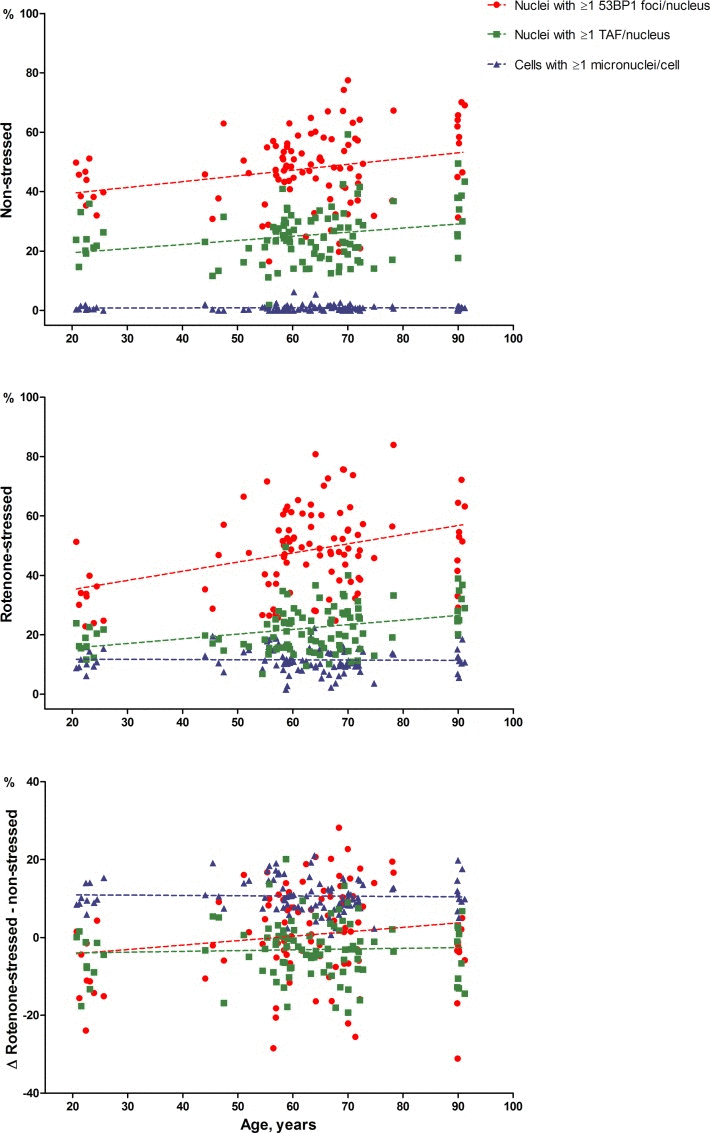
Figure 1.53BP1 foci, TAF and micronuclei dependent on chronological ageThe average percentage of nuclei with ≥1 53BP1 foci (circles) or TAF (squares) per nucleus and the average percentage of cells with ≥1 micronucleus (triangles) are depicted on the y-axis. Average percentages of duplicate series were used. Unadjusted regression lines are shown.