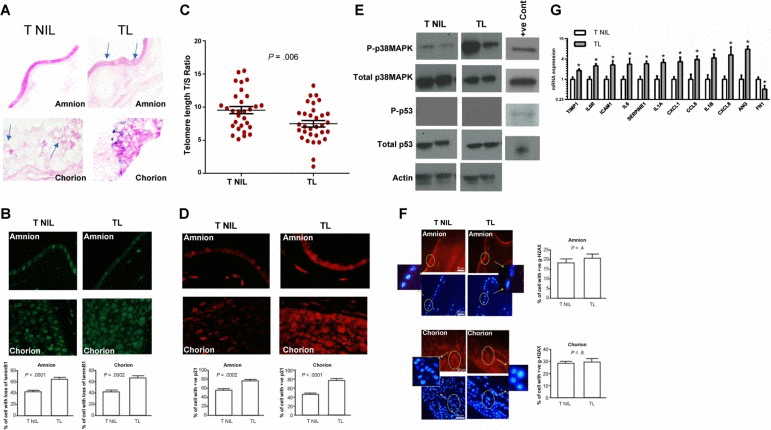
Figure 1.Cellular senescence in TL vs TNIL(A) Light microscopy of SA-β-gal staining: SA-β-gal stained cells (blue staining) from TL and TNIL (published data). The number of blue stained cells was significantly higher in both amnion and chorion from TL than TNIL (40x). (B) Microscopy of lamin B1 staining: Loss of lamin B1 is a sign of senescence. TL amnion (top) and chorion (bottom) had more loss of lamin B1 than TNIL (n=10) (40x) in each group. The percentage of cells with loss of lamin B1 was significantly higher in both compartments from TL than TNIL. Bar graphs represent the significant differences in the percentage of cells with loss of lamin B1. (C) Telomere length comparisons between TNIL and TL placental membranes samples are represented as T/S ratio. A significant decrease in telomere length was seen in TL samples compared to TNIL samples. (D) Microscopy of p21 immunostaining: p21 was not seen in our Western blot analysis; however, immunostaining of total p21 demonstrated increased staining in both amnion (top) and chorion (bottom) (40x) compartments of TL placental membranes but not in TNIL (n=10 in each group). The percentage of cells staining for p21 was significantly higher in both compartments from TL than from TNIL. Bar graphs represent the significant differences in the percentage of cells with p21 staining. (E) Representative blot images of P-p38 MAPK, total p38 MAPK, P-p53, and total p53 (from an n=10) in TNIL vs TL. P-p38 MAPK was intense in membranes from TL compared to TNIL. P-p53 was not seen in either TNIL or TL membranes, whereas total p53 was in both membranes. (F) Microscopy of Immunostaining for γ-H2AX: γ-H2AX or DNA damage foci indicate activation of DNA damage repair pathway. Neither amnion (top panel—red staining, below DAPI, inset shows γ-H2AX localization) nor chorion (bottom panel—red staining, below DAPI, inset shows γ-H2AX localization) from TNIL and TL showed any significant difference in the number of γ-H2AX stained cells (n=10). Bar graphs represent the percentage of cells with γ-H2AX staining. (G) qRT-PCR data of senescence and SASP-associated genes demonstrate significant changes in TIMP1, IL6R, ICAM1, IL6, SERPINE1, IL1A, CXCL1, CCL8, IL1B, CXCL8, ANG, and FN1 between TL and TNIL placental membranes.