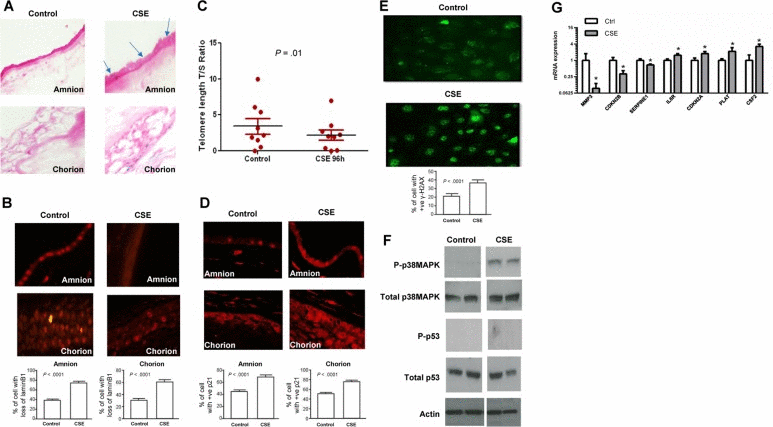
Figure 2.Cellular senescence in CSE-treated membranes(A) Light microscopy of SA-β-gal staining (blue staining). The number of blue stained cells was significantly higher in both amnion and chorion after CSE treatment than in untreated controls (40x) (n=10). (BMicroscopy of lamin B1 staining: Similar to TL, lamin B1 loss was higher after CSE treatment in placental membrane amnion (top) and chorion (bottom) layers. Bar graphs represent the significant differences in loss of lamin B1. (C) Telomere length comparisons between untreated ‘control’ and CSE-treated amnion epithelial cells after 96 hours in culture. A significant decrease in telomere length was seen after CSE treatment of primary amnion epithelial cells derived from TNIL membranes in culture. (D) Microscopy of p21 immunostaining: Similar to TL, immunostained amnion (top) and chorion cells (bottom) were much higher after CSE treatment than untreated controls (n=10 in each group). Bar graphs represent the significant differences in the percentage of cells with p21 staining. (E) Microscopy of immunostaining for γ-H2AX: Primary amnion epithelial cells (AECs) from TNIL exposed to CSE (bottom panel) had a significantly higher number of γ-H2AX staining cells than untreated controls (n=5). Bar graphs represent the significant differences in γ-H2AX staining cells between the groups. (F) A representative blot of images of p38 MAPK and p53 in vitro. Similar to TL and TNIL, cultured placental membranes did not demonstrate any activation of p53 (n=10). Total p53 was seen in both CSE-treated and untreated controls, and no visible change in band intent sites were noted. (G) qRT-PCR data of senescence and SASP-associated genes demonstrate significant changes in MMP3, CDKN2B, SERPINE1, IL6R, CDKN2A, PLAT, and CSF2 between controls and CSE-treated placental membranes.