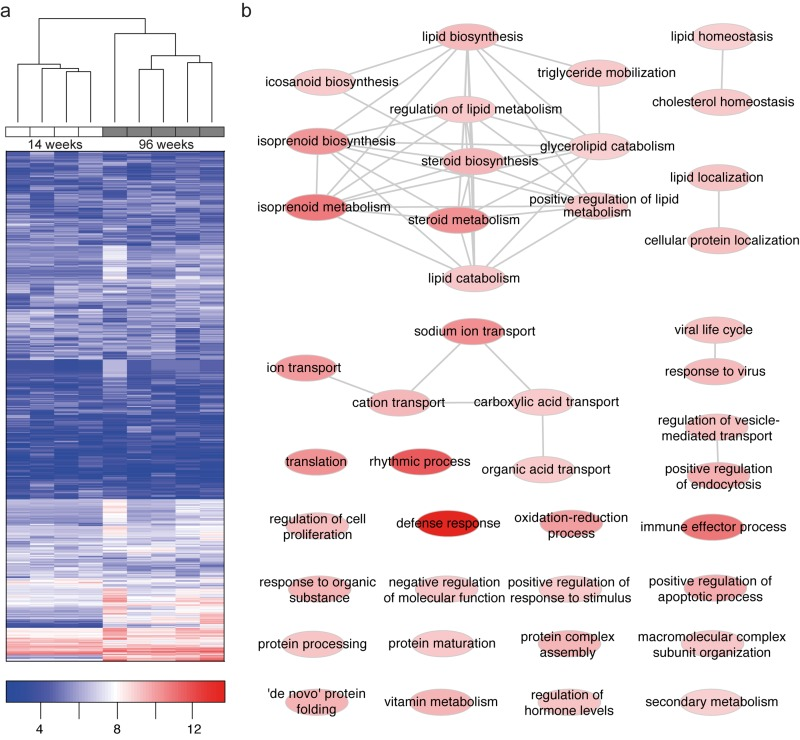
Figure 2.Microarray analysis reveals age-specific clustering and differentially expressed genes to be associated with lipid metabolism(a) Hierarchical clustering of 1000 genes with the strongest variation reveals age-specific clustering. Genes with low expression are depicted in blue color, genes with high expression in red color. (b) Gene ontology (GO) enrichment of differentially expressed genes (96W – 14W WT kidney). We observed a strong enrichment of lipid and lipoprotein metabolism, of immune system and defense response, of small ion transport and transmembrane transport in aged wild-type kidneys (see also Data Set 2). Nodes of GO terms are color-coded according to enrichment strength.