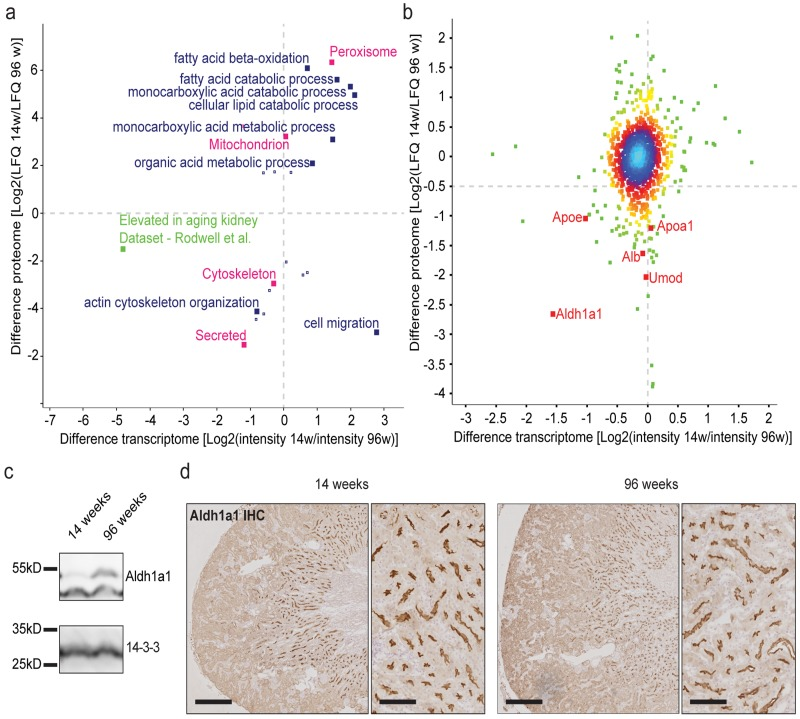
Figure 3.Proteome analysis depicts little correlation between transcriptome and proteome. Aldh1a1 is identified as an aging marker in the kidney(a) 2D GO enrichment analysis. Positive values indicate higher RNA expression or protein abundance per GO term in 14 week old samples. Negative values show higher expression / abundance per GO term in 96 week old samples. Blue: Gene ontology biological process (GOBP), red: selected UniProt keywords, green: representation of published geneset (b) Correlation analysis of transcriptome and proteome differences between age groups. Positive values indicate higher RNA expression or protein abundance in 14 week old samples. Negative values show higher expression / abundance in 96 week old samples. Colors depict proximity values ranging from blue (very close together) to dark green. Aldh1a1 shows the highest difference and correlation. (c) Immunoblot for Aldh1a1 shows a clear increase in protein content in 96 week old kidney lysates. 14-3-3 was used as a loading control. (d) Immunohistochemistry for Aldh1a1 on formalin-fixed paraffin-embedded mouse kidney tissue. Staining showed a clear localization to the brush border of the medullary thick ascending limb (mTAL) segment. This staining did not vary in intensity and localization between age groups. **p<0.01; Scale bars in left panels indicate 400μm. Scale bars in right panels indicate 100μm.