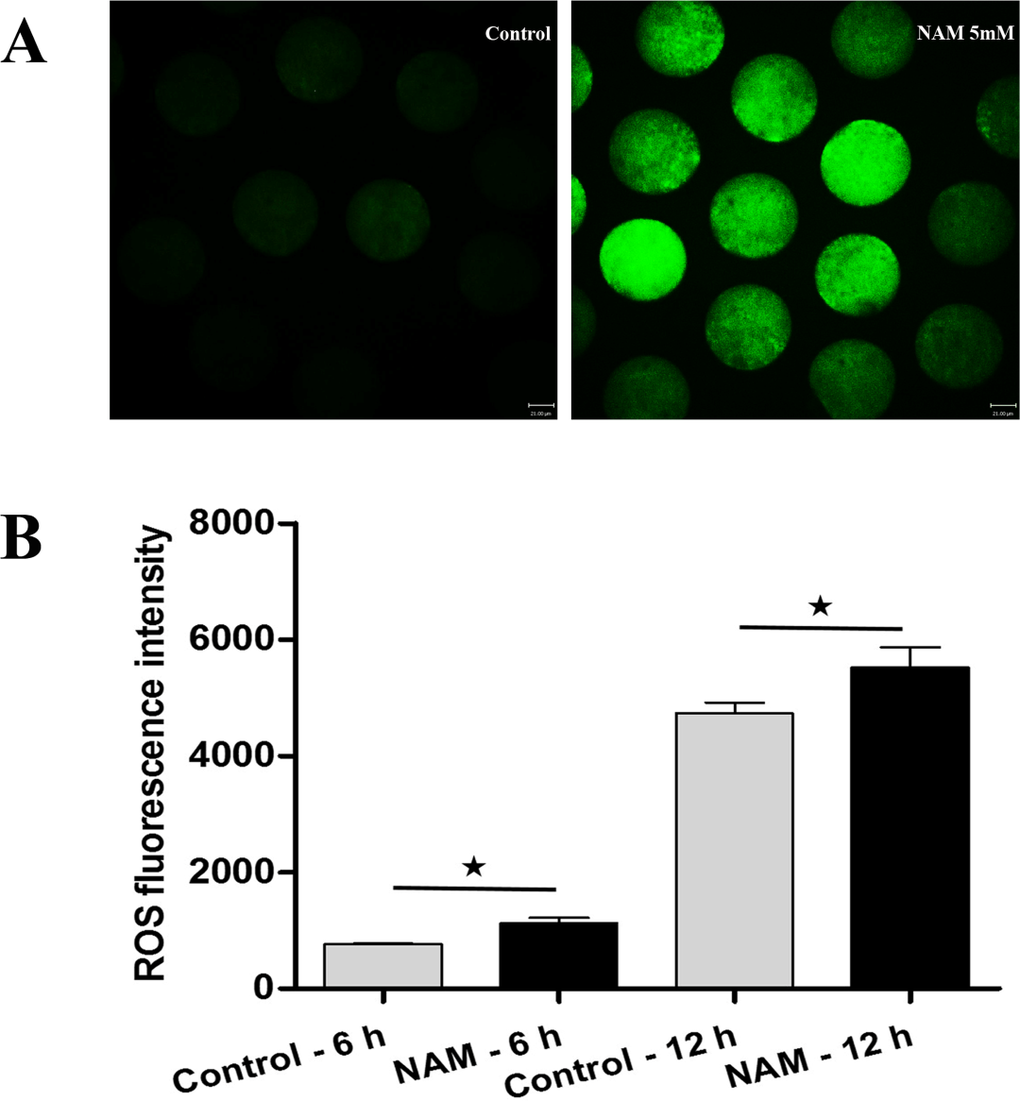
Figure 2.Analysis of ROS production in MII oocytes(A) Representative images of carboxy-H2DCF fluorescence in control and NAM-treated oocytes. Scale bar: 21 μm. (B) After culture of MII oocytes for 6 h and 12 h in the presence or absence of SIRT1,2,3-nonspecific inhibitor, quantitative analysis of fluorescence intensity was conducted.*Significantly different (P < 0.05).