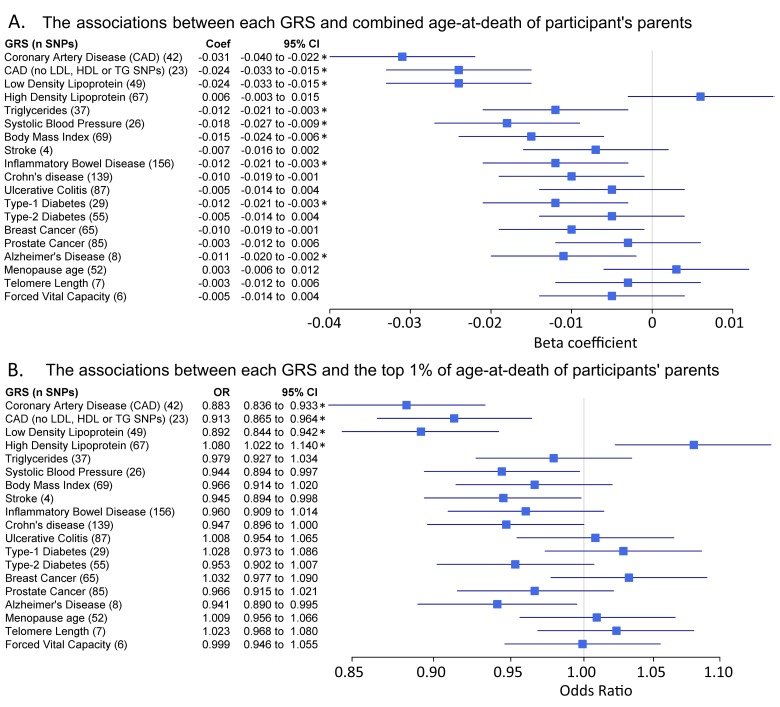
Figure 1.Genetic risk score associations with parents age at deathForest plots show the relationship between the genetic risk scores (GRS, z-transformed) and 2 different parental longevity traits. Results from regression models (see methods). * indicates the association is significant after adjustment for multiple testing. (A) Linear regression results for combined parent's age at death. N=45,627. Coefficients (‘coef’) show the standard deviation (SD) difference in GRS per SD of parent's age at death. The results for `CAD (no Lipids)` and `LDL cholesterol` only appear identical due to rounding; the effects were very similar. (B) Logistic regression results for the binary trait “participants of at least one parent reaching the top 1% of the age-at-death distribution vs. participants who parents did not”. Discordant participants (i.e. one long-lived and one short-lived) were excluded. n=42,273. n=1,339 participants of at least one long-lived parent (mother aged ≥98 years or father aged ≥95 years). Includes participants with alive parents reaching these limits. Odds Ratios (OR) show the likelihood of participants having at least 1 parent reaching the top 1% of age-at-death distribution per SD difference in GRS.