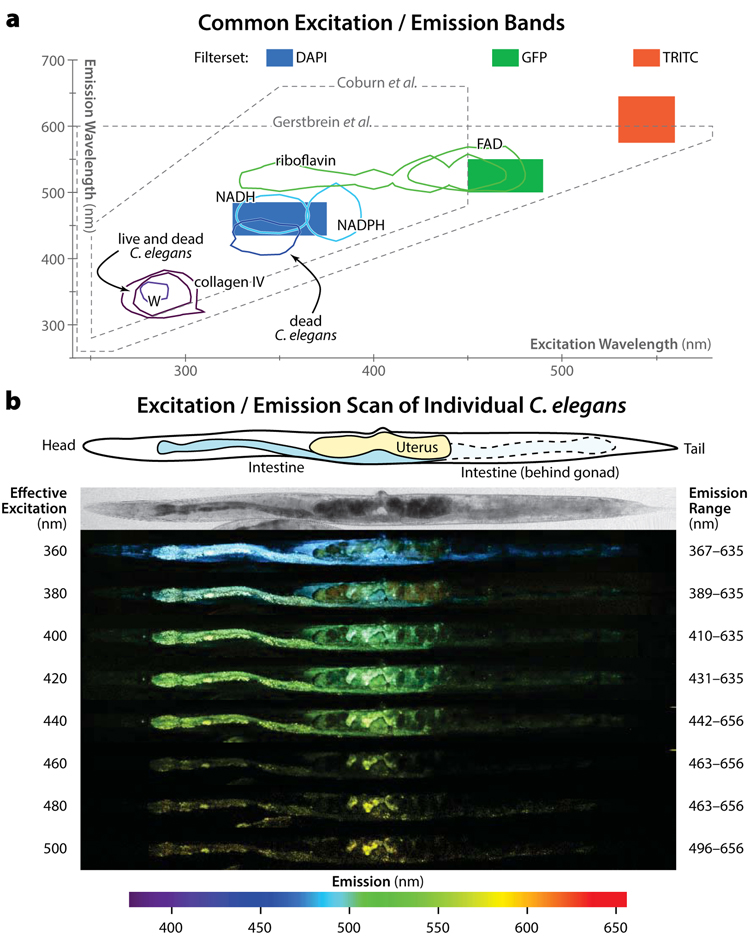
Figure 1.Spectral properties of autofluorescent materials in C. elegans(a) Fluorescent excitation/emission wavelengths of note are show. First, using data from DaCosta et al. [28], we plot contours containing 75% of the overall fluorescence emission intensity for several common autofluorescent biomolecules: tryptophan (W), collagen IV, NADH, NADPH, riboflavin, and FAD. Next, we plot the 75% contours of autofluorescent peaks for living and dead C. elegans using data from Coburn et al. [17]. The excitation/emission range analyzed in that work is shown with a dashed line. The range analyzed by a previous quantitative study of C. elegans autofluorescence by Gerstbrein et al. [16] is likewise shown. Of note, neither study covered excitation and emissions in the yellow/red wavelengths. The data presented in this work was generated using three fluorescent filter sets with excitation/emission wavelengths as diagrammed by the colored boxes. Blue (DAPI filterset): 350/50 nm (center wavelength / bandwidth) excitation 460/50 nm emission; Green (GFP filterset): 470/40 nm ex, 525/50 nm em; Red (TRITC filterset): 545/30 nm ex, 610/70 nm em. (b) A single animal at the fourth day of adulthood (near the end of the reproductive span) was imaged with two-photon confocal microscopy in multiple excitation wavelengths using a tunable laser. For each effective excitation wavelength (i.e. the single-photon equivalent of half the actual laser wavelength), emissions in the specified wavelengths are shown. After computationally straightening the images, fluorescence emissions (captured into bins of ∼10 nm width) were false-colored according to their wavelength, per the color bar below. All emissions for a given excitation wavelength are shown superimposed into a single image. At top, the position of the intestine and uterus is sketched and shown in a brightfield image. At the rear of the animal, the intestine is overlapped by the posterior gonad arm, causing it to be slightly obscured (sketched by dashed lines). The uterus is filled with unfertilized oocytes, visible in the images as dark circles. Note that relative emission intensities can be compared within, but not between, specific excitation wavelengths.