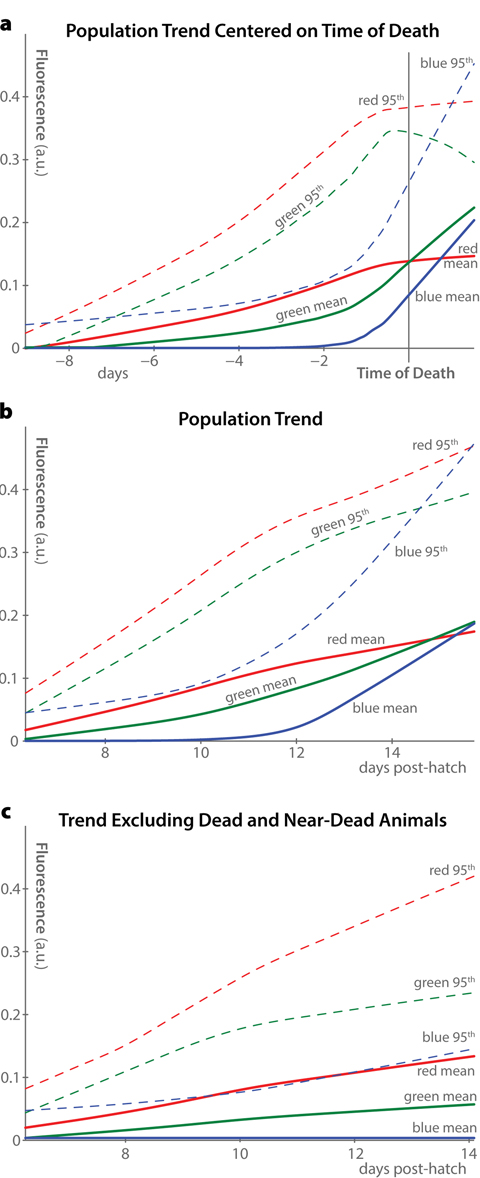
Figure 3.Population trends in autofluorescence(a) Average trends in autofluorescence across all 40 individuals in the dataset are plotted, aligned at the time of death of each individual. Two measurements of fluorescence were calculated for each individual at each timepoint in each fluorescence channel: the mean whole-body fluorescence intensity, and the 95th percentile of fluorescence intensity. LOWESS nonparametric regression was used to fit smooth curves through the measured data, producing the shown population-average trends. (b) Curves similar to panel a are plotted, using the time of hatching rather than time of death as the alignment point. (c) By excluding animals within 12 hours of death from the plots in panel b, it becomes clear that the majority of the increase in blue and green fluorescence, but not red fluorescence, is driven by increases immediately before organismal death.