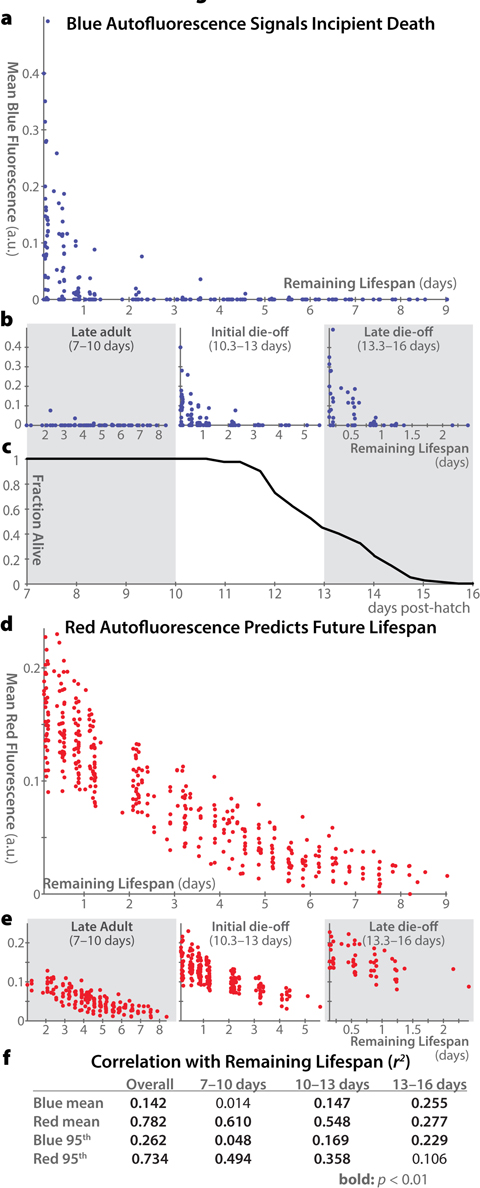
Figure 4.Correlations between autofluorescence and remaining lifespan(a) Whole-body mean blue autofluorescence is plotted for each individual at each timepoint versus that individual's remaining lifespan at that timepoint (a rough proxy for individual health). (b) Plots as in panel a are shown for animals in different age ranges: 7–10 days post hatch (in which range all of the population remains alive), 10.3–13 days (during which approximately the first half of the deaths occur), and 13.3–16 days (during which the remaining deaths occur). Correlation between blue autofluorescence and future lifespan is most pronounced only in older animals with very few days of life remaining. (c) Lifespan curve for the 40 individuals in the experiment showing the fraction of animals alive within each of the time ranges plotted in panel b. (d, e) Mean red autofluorescence versus remaining lifespan is plotted for all individuals at all timepoints (d) and for specific age ranges (e), as in panels a and b. (f) Pearson coefficients of determination (r2) between autofluorescence and remaining lifespan are shown for whole-body mean and 95th-percentile fluorescence in different age ranges. Values with p-values < 0.01 according to an F-test are shown in bold. Overall, whole-body mean red autofluorescence can account for 78.2% of the total variability in lifespan remaining in a population of adult animals.